Uptime Monitoring + End-User Experience Monitoring for Citrix & VDI | LoadGen
Uptime says the broker answered. End-to-end monitoring says a real user logged in — in 45 seconds. Why VDI needs both, and how to run them on one platform.
LoadGen Engineering
Product Strategy
Uptime monitoring proves your endpoints answered. End-to-end monitoring proves a real user could actually log in and work. In VDI, the gap between those two sentences is where every support ticket lives.
Two questions that sound the same
Ask an infrastructure team "is Citrix healthy?" and you'll get an availability number. Ask a user the same question and you'll get "it takes two minutes to log in." Both are telling the truth. They are answering different questions:
| Uptime Monitoring | End-to-End Monitoring | |
|---|---|---|
| The question | Is the endpoint answering? | Can a real user log in and do their work — and how long does it take? |
| How it runs | Checks probe from the appliance | Real sessions run on your agents, in the real client |
| Cost per run | Cheap — run it every minute | Expensive — run it on a schedule |
| Catches | Outages, certificate expiry, DNS failures, dead ports, degraded response | Slow logons, broken auth chains, failed app launches, gradual degradation |
| Misses | Everything that is slow but technically "up" | The 90 seconds between scheduled runs |
The trap: run only uptime and you get green dashboards during a bad week. Run only end-to-end and you find out about a hard outage on the next schedule tick instead of immediately.
Run both and each covers the other's blind spot.
Half one: uptime, from the appliance
LoadGen Uptime is not just an HTTP pinger. The engine ships 20+ check types, which matters in EUC because the failure is rarely the web page:
- Web / HTTP — HTTP(S), REST API with body and response validation, header checks, body regex
- Network — TCP port, UDP port, ICMP ping
- Name & time — DNS resolve, DNS authority (against a specific name server), WHOIS expiry, NTP offset
- Mail & transport — SMTP, FTP, SSH banner handshakes
- Certificate & security — TLS cipher/protocol probe, HSTS validation, standalone certificate-chain check
- Cloud & custom — Azure Function, Azure App Service, PowerShell script checks, custom plugin checks
Around the checks sits the operational machinery: a guided 10-step check wizard, incidents with dependency trees (so one broker outage doesn't page you eleven times), maintenance windows to suppress planned noise, and four alert types — Failure, Recovery, Degraded and SSL Expiry.
That SSL-expiry alert has quietly saved more Monday mornings than any dashboard.
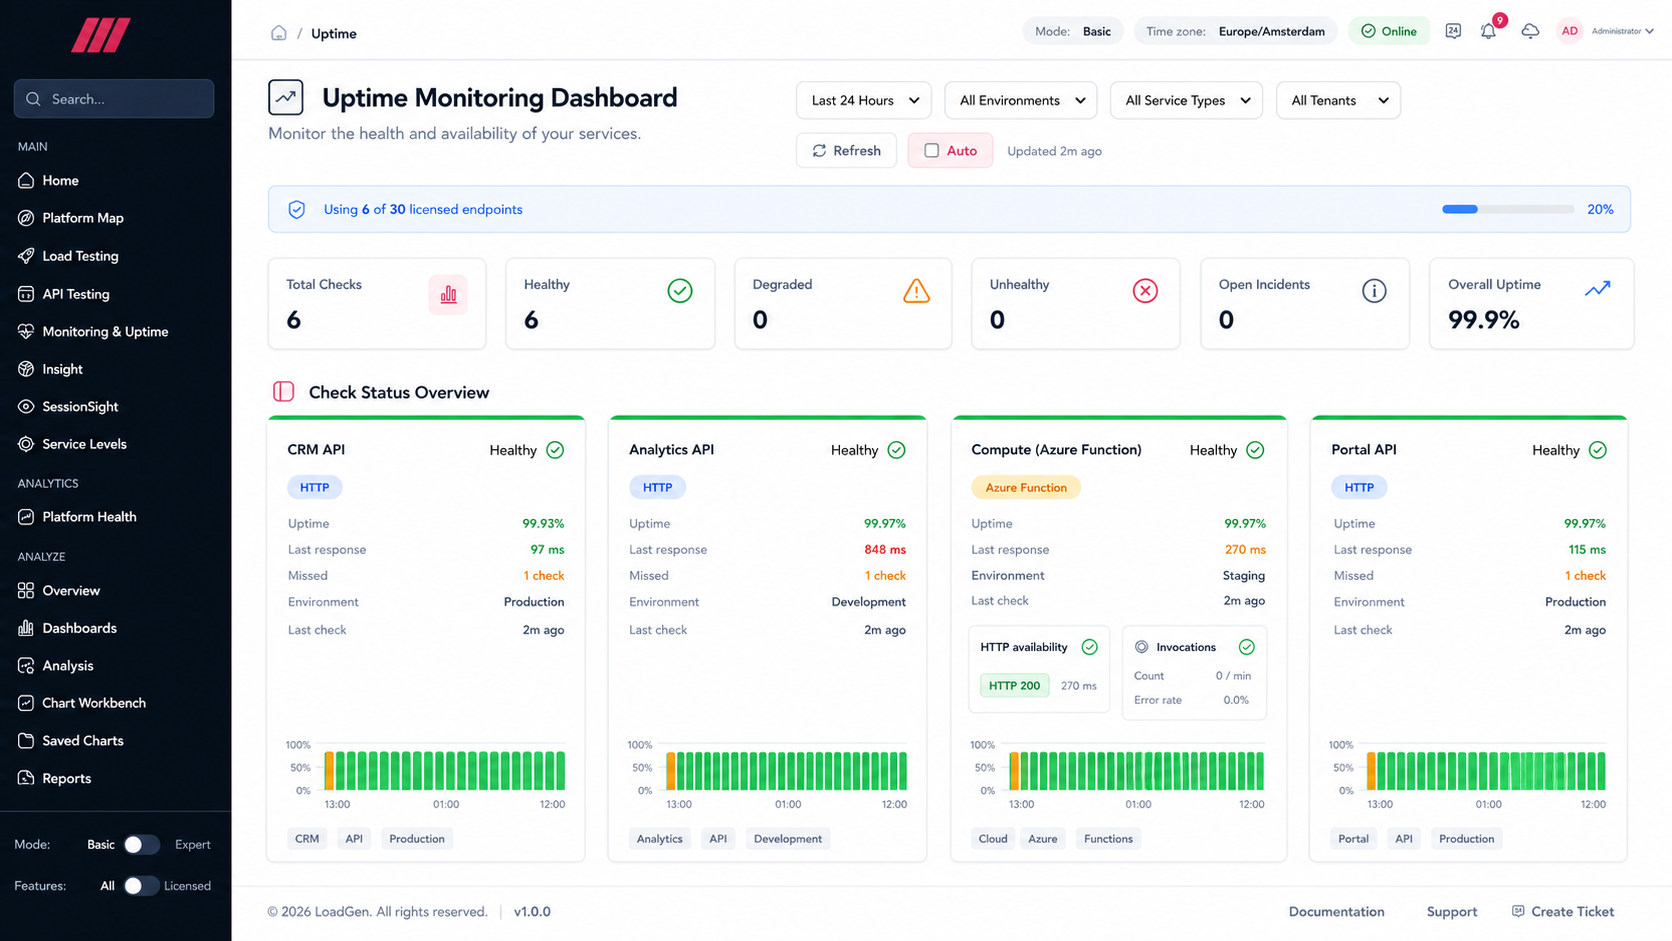 The Uptime dashboard: KPI tiles (Total Checks, Healthy, Degraded, Unhealthy, Open Incidents, Overall Uptime %), licence usage, and Check Status Overview cards showing per-check uptime %, last response time, missed checks, environment and a 24-hour availability sparkline. The Azure Function card shows its own sub-panels (HTTP availability, invocation count, error rate vs threshold).
Half two: end-to-end, on real agents
An end-to-end monitor is a real session. An agent opens the real client, authenticates through the real chain, launches the real application, and times each step — on a schedule, forever.
- 8 target environments: Citrix, Citrix Enhanced, Azure Virtual Desktop, Omnissa Horizon, RDS, Fat Client, Web Testing, Command Line
- 10-step profile wizard — name, target environment, agents, workload type, workload, datasource, schedule, systems under test, alerting, summary
- Per-step measurements, not a single "logon time" blob — so you can see which step grew
- Period metrics vs baseline — mean, P50, P90, P95, moving average and delta %, per measurement
- Agent status built in — online, delayed, no data, disabled — because a monitor that silently stopped reporting is worse than no monitor
- Alerting on Email, Webhook, SMS and WhatsApp
The measurements are the same shape as your load-test measurements, which is the quiet superpower: the thing you tested in pre-production is the thing you monitor in production.
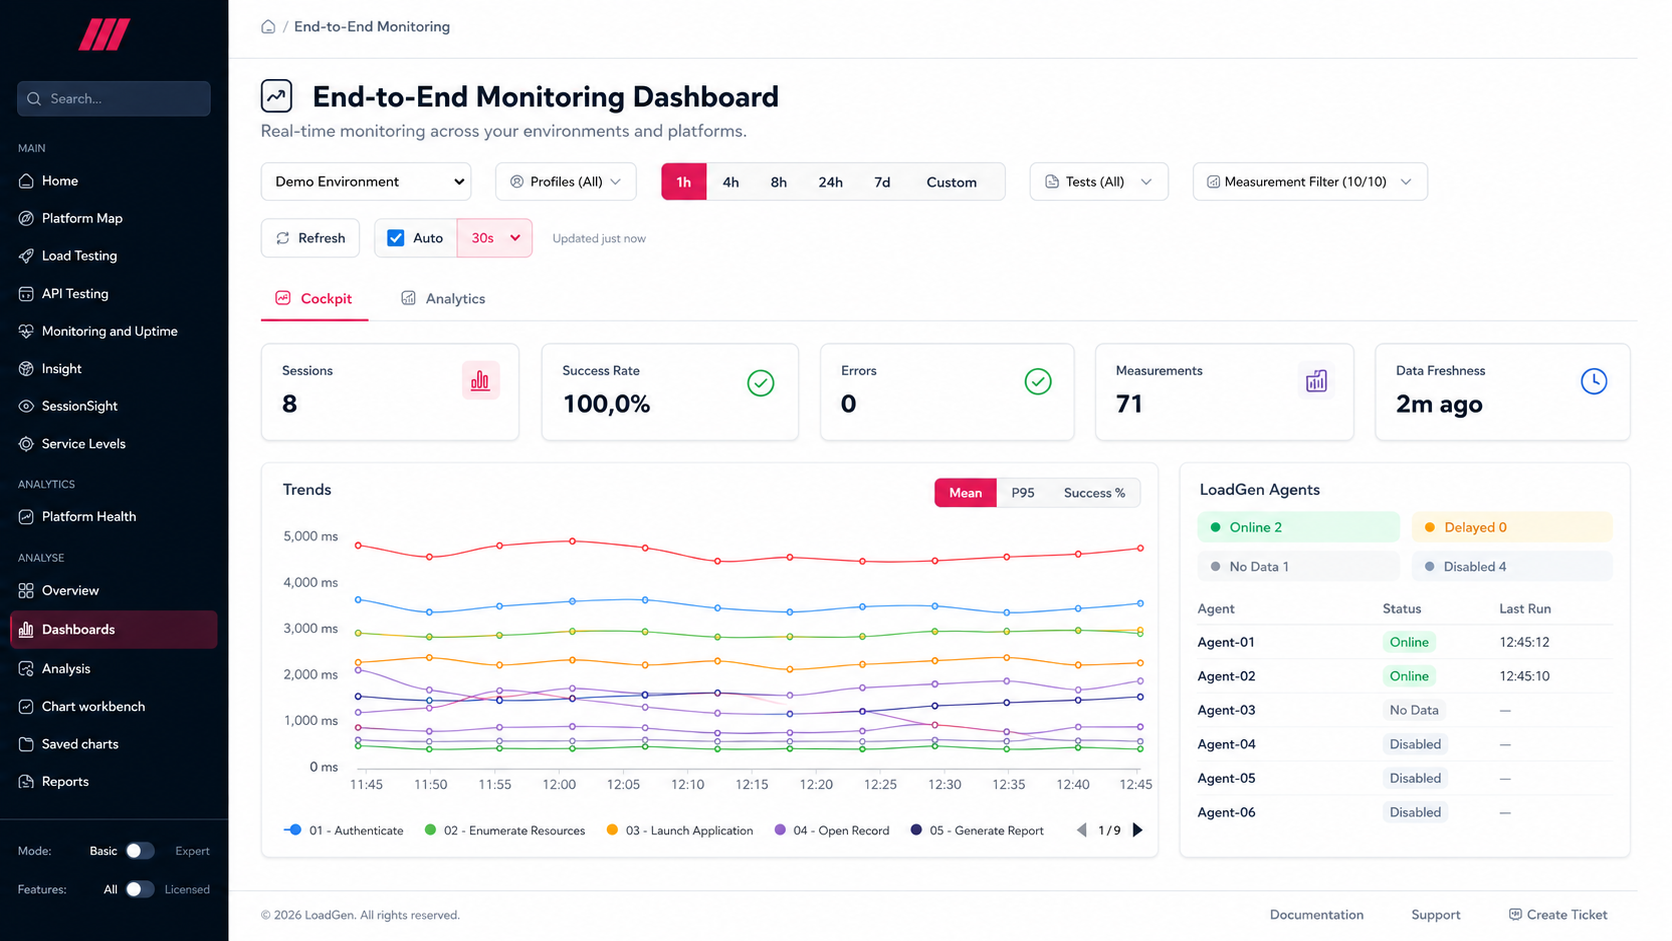 The E2E Monitoring dashboard: datasource and time-range selectors, KPI tiles (Sessions, Success Rate, Errors, Measurements, Data Freshness), a multi-series Trends chart with Mean / P95 / Success % toggles, a LoadGen Agents panel (Online / Delayed / No Data / Disabled), and per-step measurement legends.
Where they meet: the same incident, twice
A worked example, because this is where the combination earns its keep.
08:41 — Uptime flags the StoreFront HTTP check as Degraded: still answering, but response time has tripled. No outage. No incident. Nobody would have noticed.
08:45 — The end-to-end Citrix monitor runs. The session completes — success rate stays 100% — but the authentication step is 4× its baseline and P95 for "application launch" crosses its threshold. An alert fires with the step name on it.
08:47 — You already know three things before the first ticket arrives: it is not down, it is authentication, and it started between 08:30 and 08:41.
Neither half gets you there alone. Uptime saw the shape of the problem; end-to-end named it.
The third piece: turn both into a commitment
Availability numbers and step timings are inputs. Service Levels turns them into something you can hold a conversation about:
- SLO types: availability, error rate, and transaction SLA
- Error budgets with multi-window, multi-burn-rate alerting — you get told when you're spending the budget too fast, not after it's gone
- Public status pages (public or password-gated) with incidents, maintenance and per-day history, and subscriptions over email, SMS, Slack and webhook
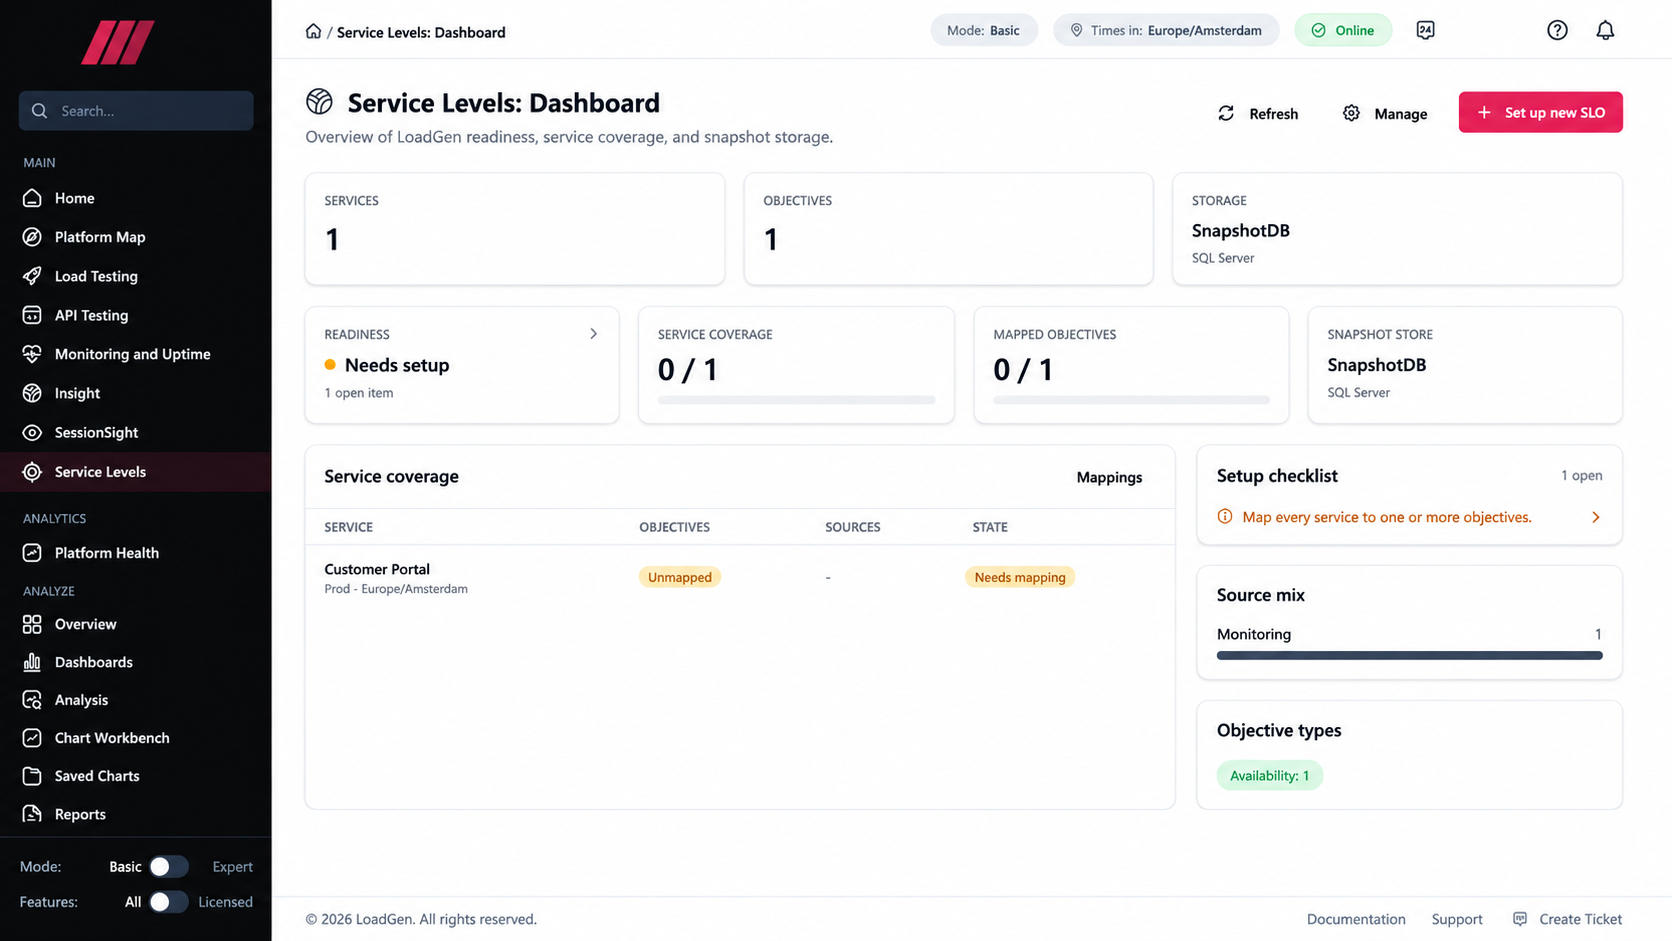 The Service Levels dashboard: services and mapped objectives, readiness state, source-mix and objective types — the surface where availability probes and end-to-end step timings become the SLOs and error budgets you commit to.
This is the difference between "we monitor Citrix" and "we committed to a logon-time objective, and here is the burn rate against it."
One platform, one health view
Because both halves run on the same platform, they roll up together. The cross-feature Analytics Dashboard scores overall system health 0–100 with a card per feature — E2E Monitoring, Uptime, API Testing, Load Testing and SessionSight — each with its own availability or success figure, plus an AI insights panel that will narrate the picture for you.
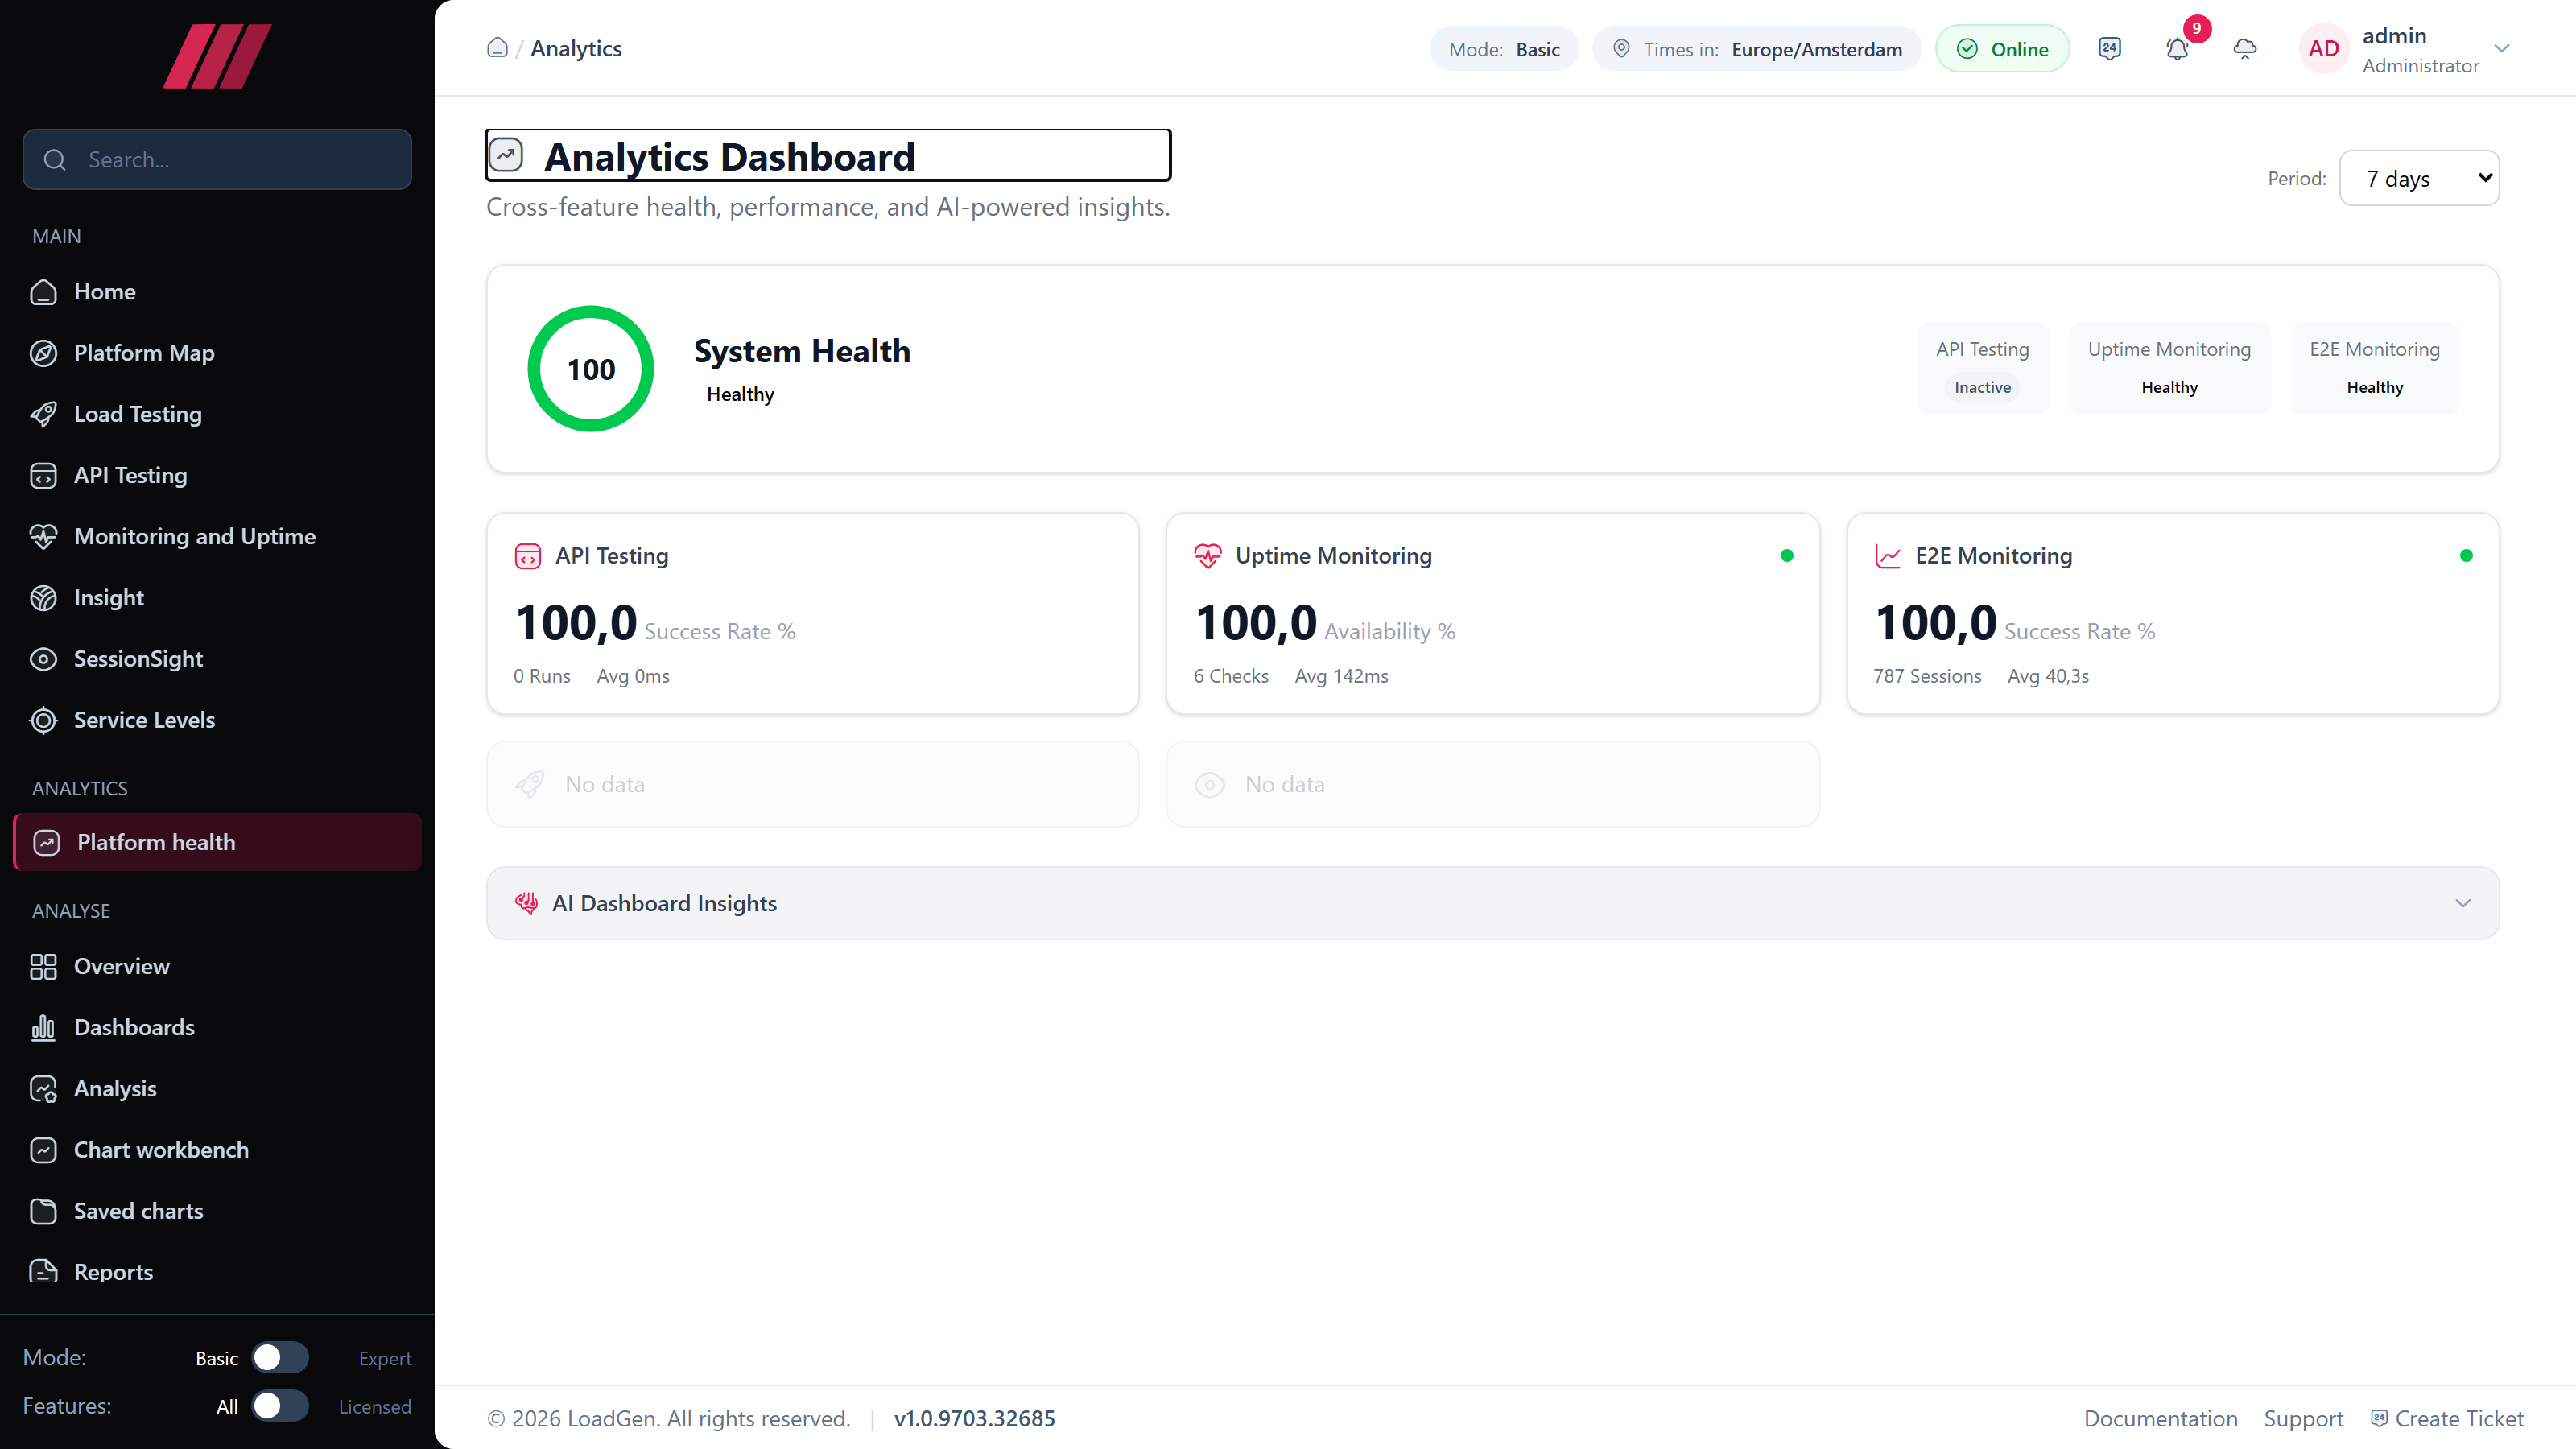 Cross-feature health: one 0–100 System Health score, per-feature cards with their own metrics and volumes, and AI Dashboard Insights. Features without data in the period say "No data" — no invented green ticks.
Same appliance, same agents, same alert profiles. Uptime checks probe from the appliance; monitoring sessions run on your agents — and both land in one health view.
Getting started, in the order that works
- Put uptime checks on the chain, not just the front door — StoreFront/Gateway URL, the broker, DNS, the certificate, and the back-end APIs the desktop actually needs.
- Build one end-to-end profile for your most representative workload — the app the loudest department uses.
- Let it run for a week to establish a baseline. Do not set thresholds before you know what normal looks like.
- Turn the two most business-critical measurements into SLOs with an error budget.
- Route alerts by severity — degraded to a channel, failure to a phone.
Stop choosing between "it's up" and "it's usable"
Run uptime checks and real end-to-end sessions on one platform, alert on both, and commit to the numbers with SLOs.
Related reads
Keep reading.
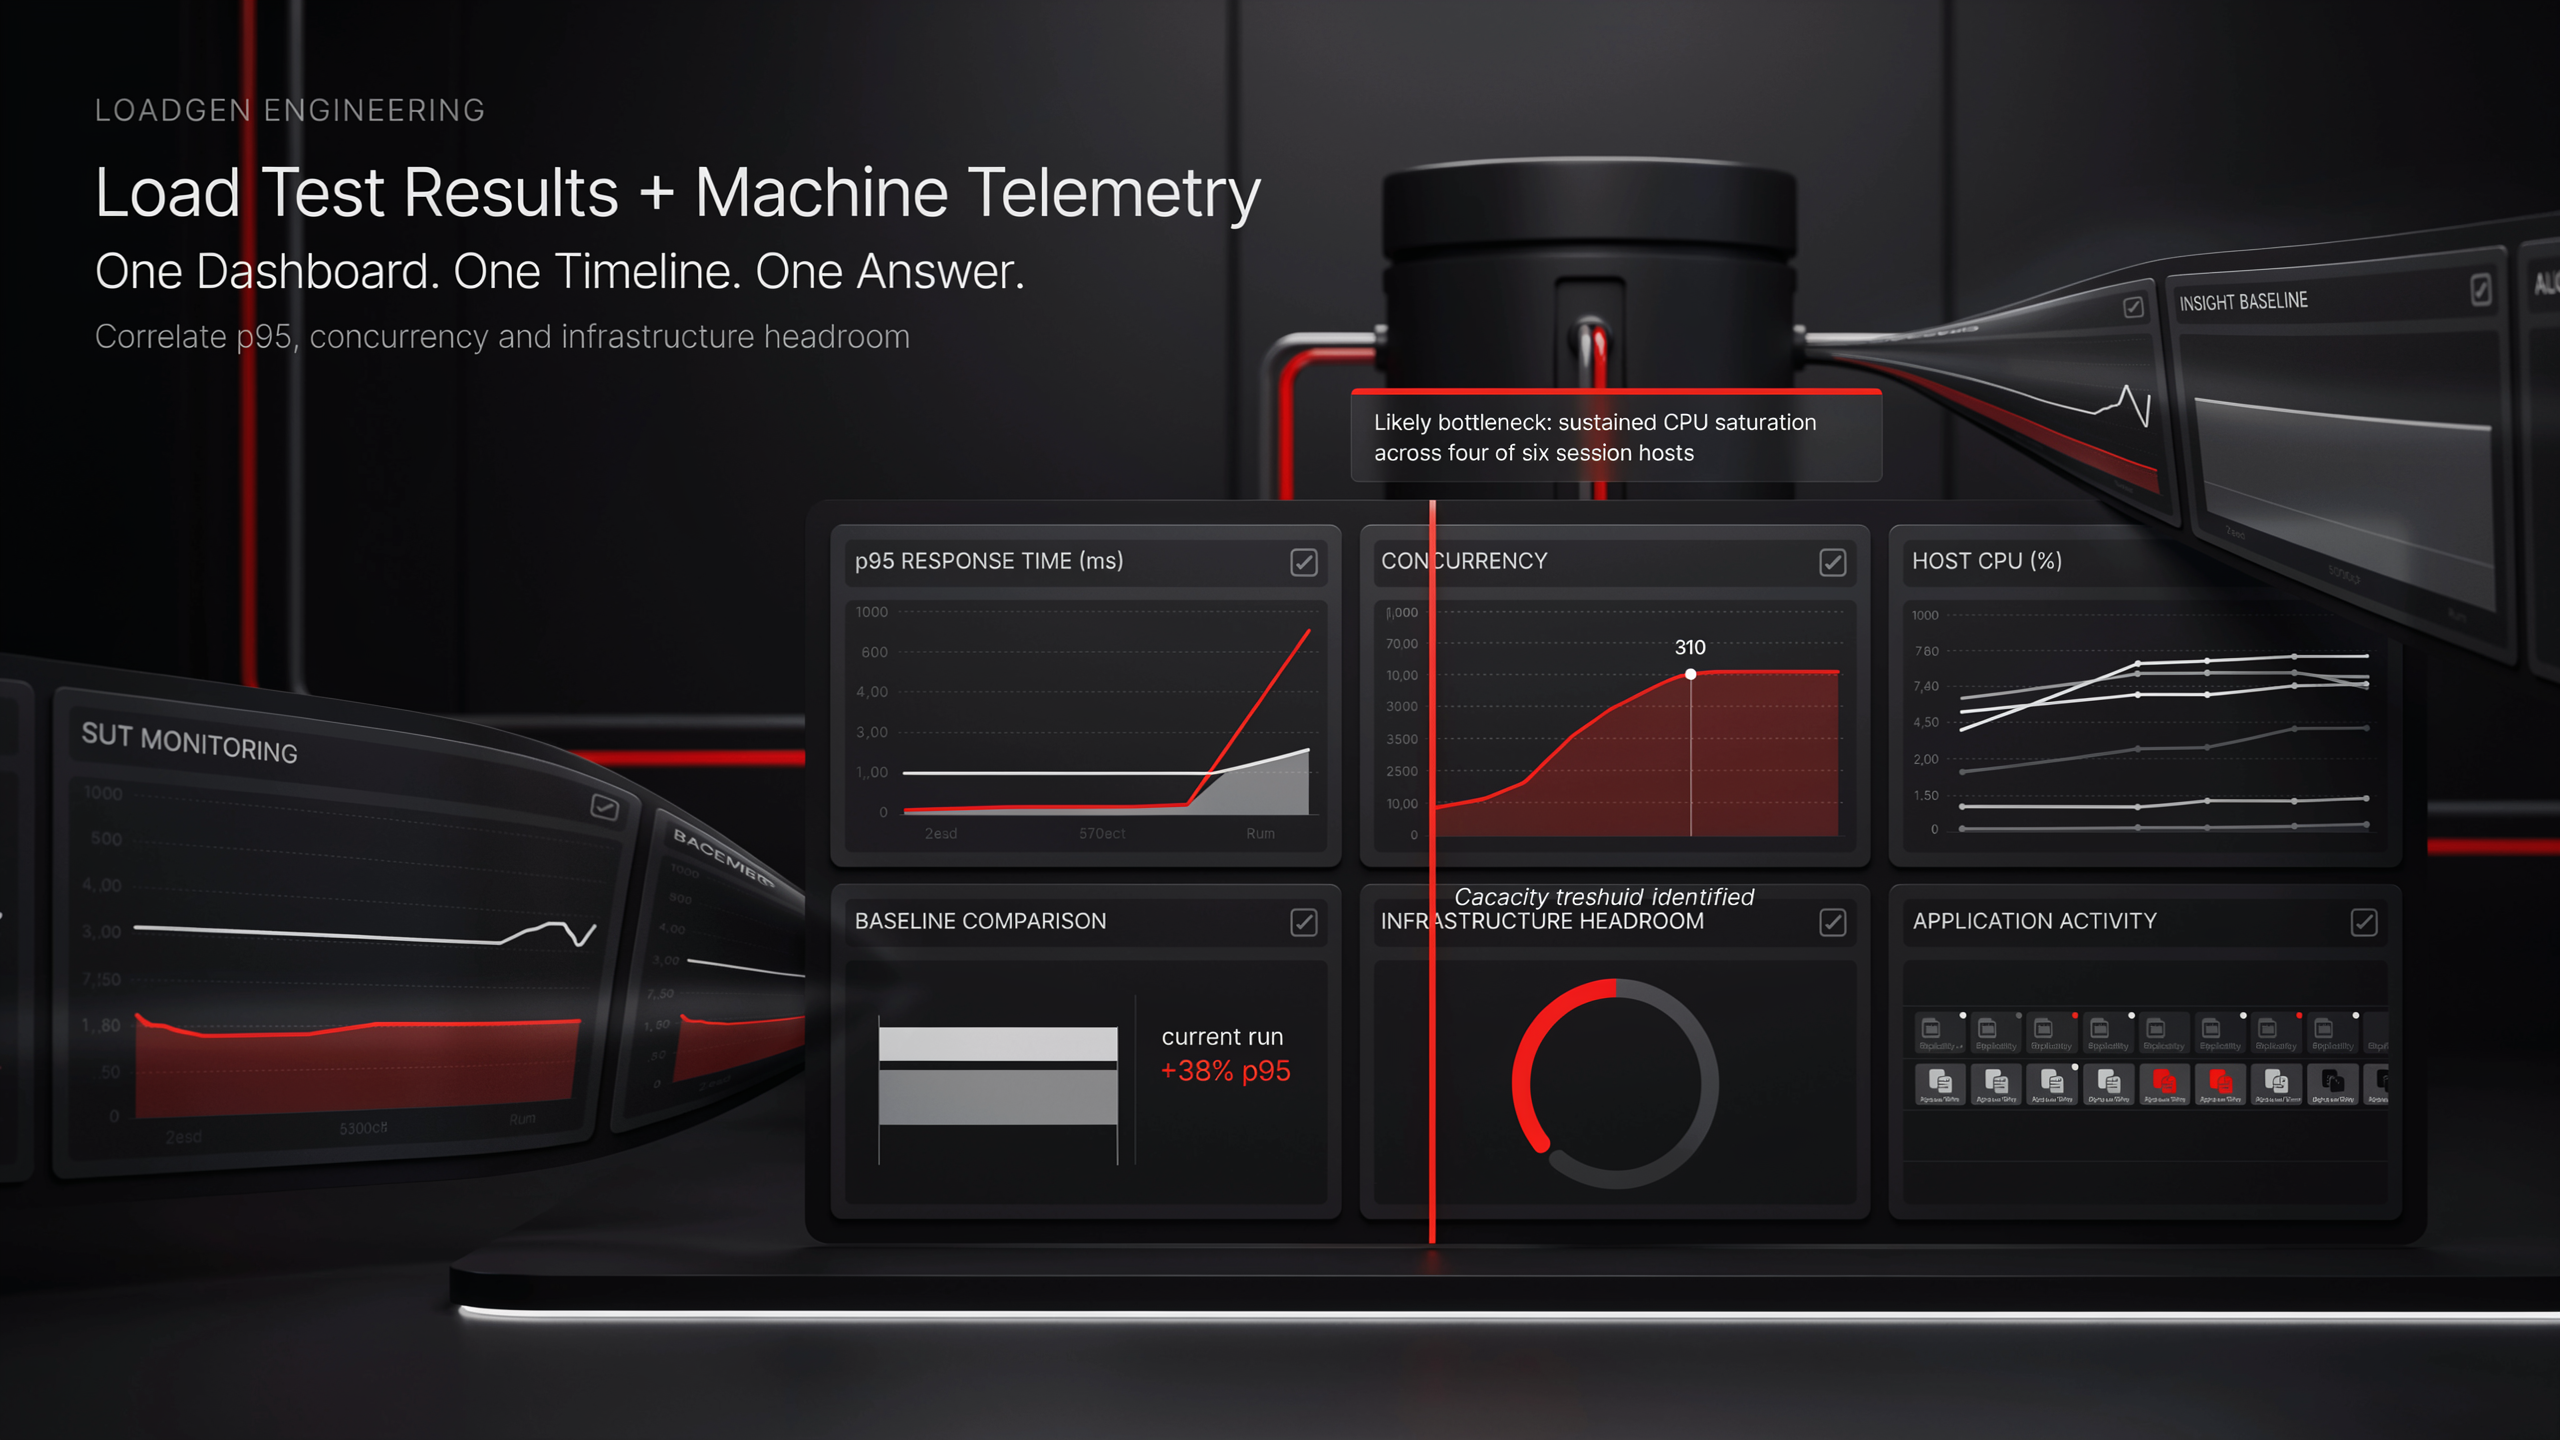
Combine Machine Telemetry with Load Test Results in One Dashboard | LoadGen
Load tests tell you p95 went up. Machine telemetry tells you why. Build one dashboard over both — in LoadGen Analyse with AI, or in Grafana over the same InfluxDB.
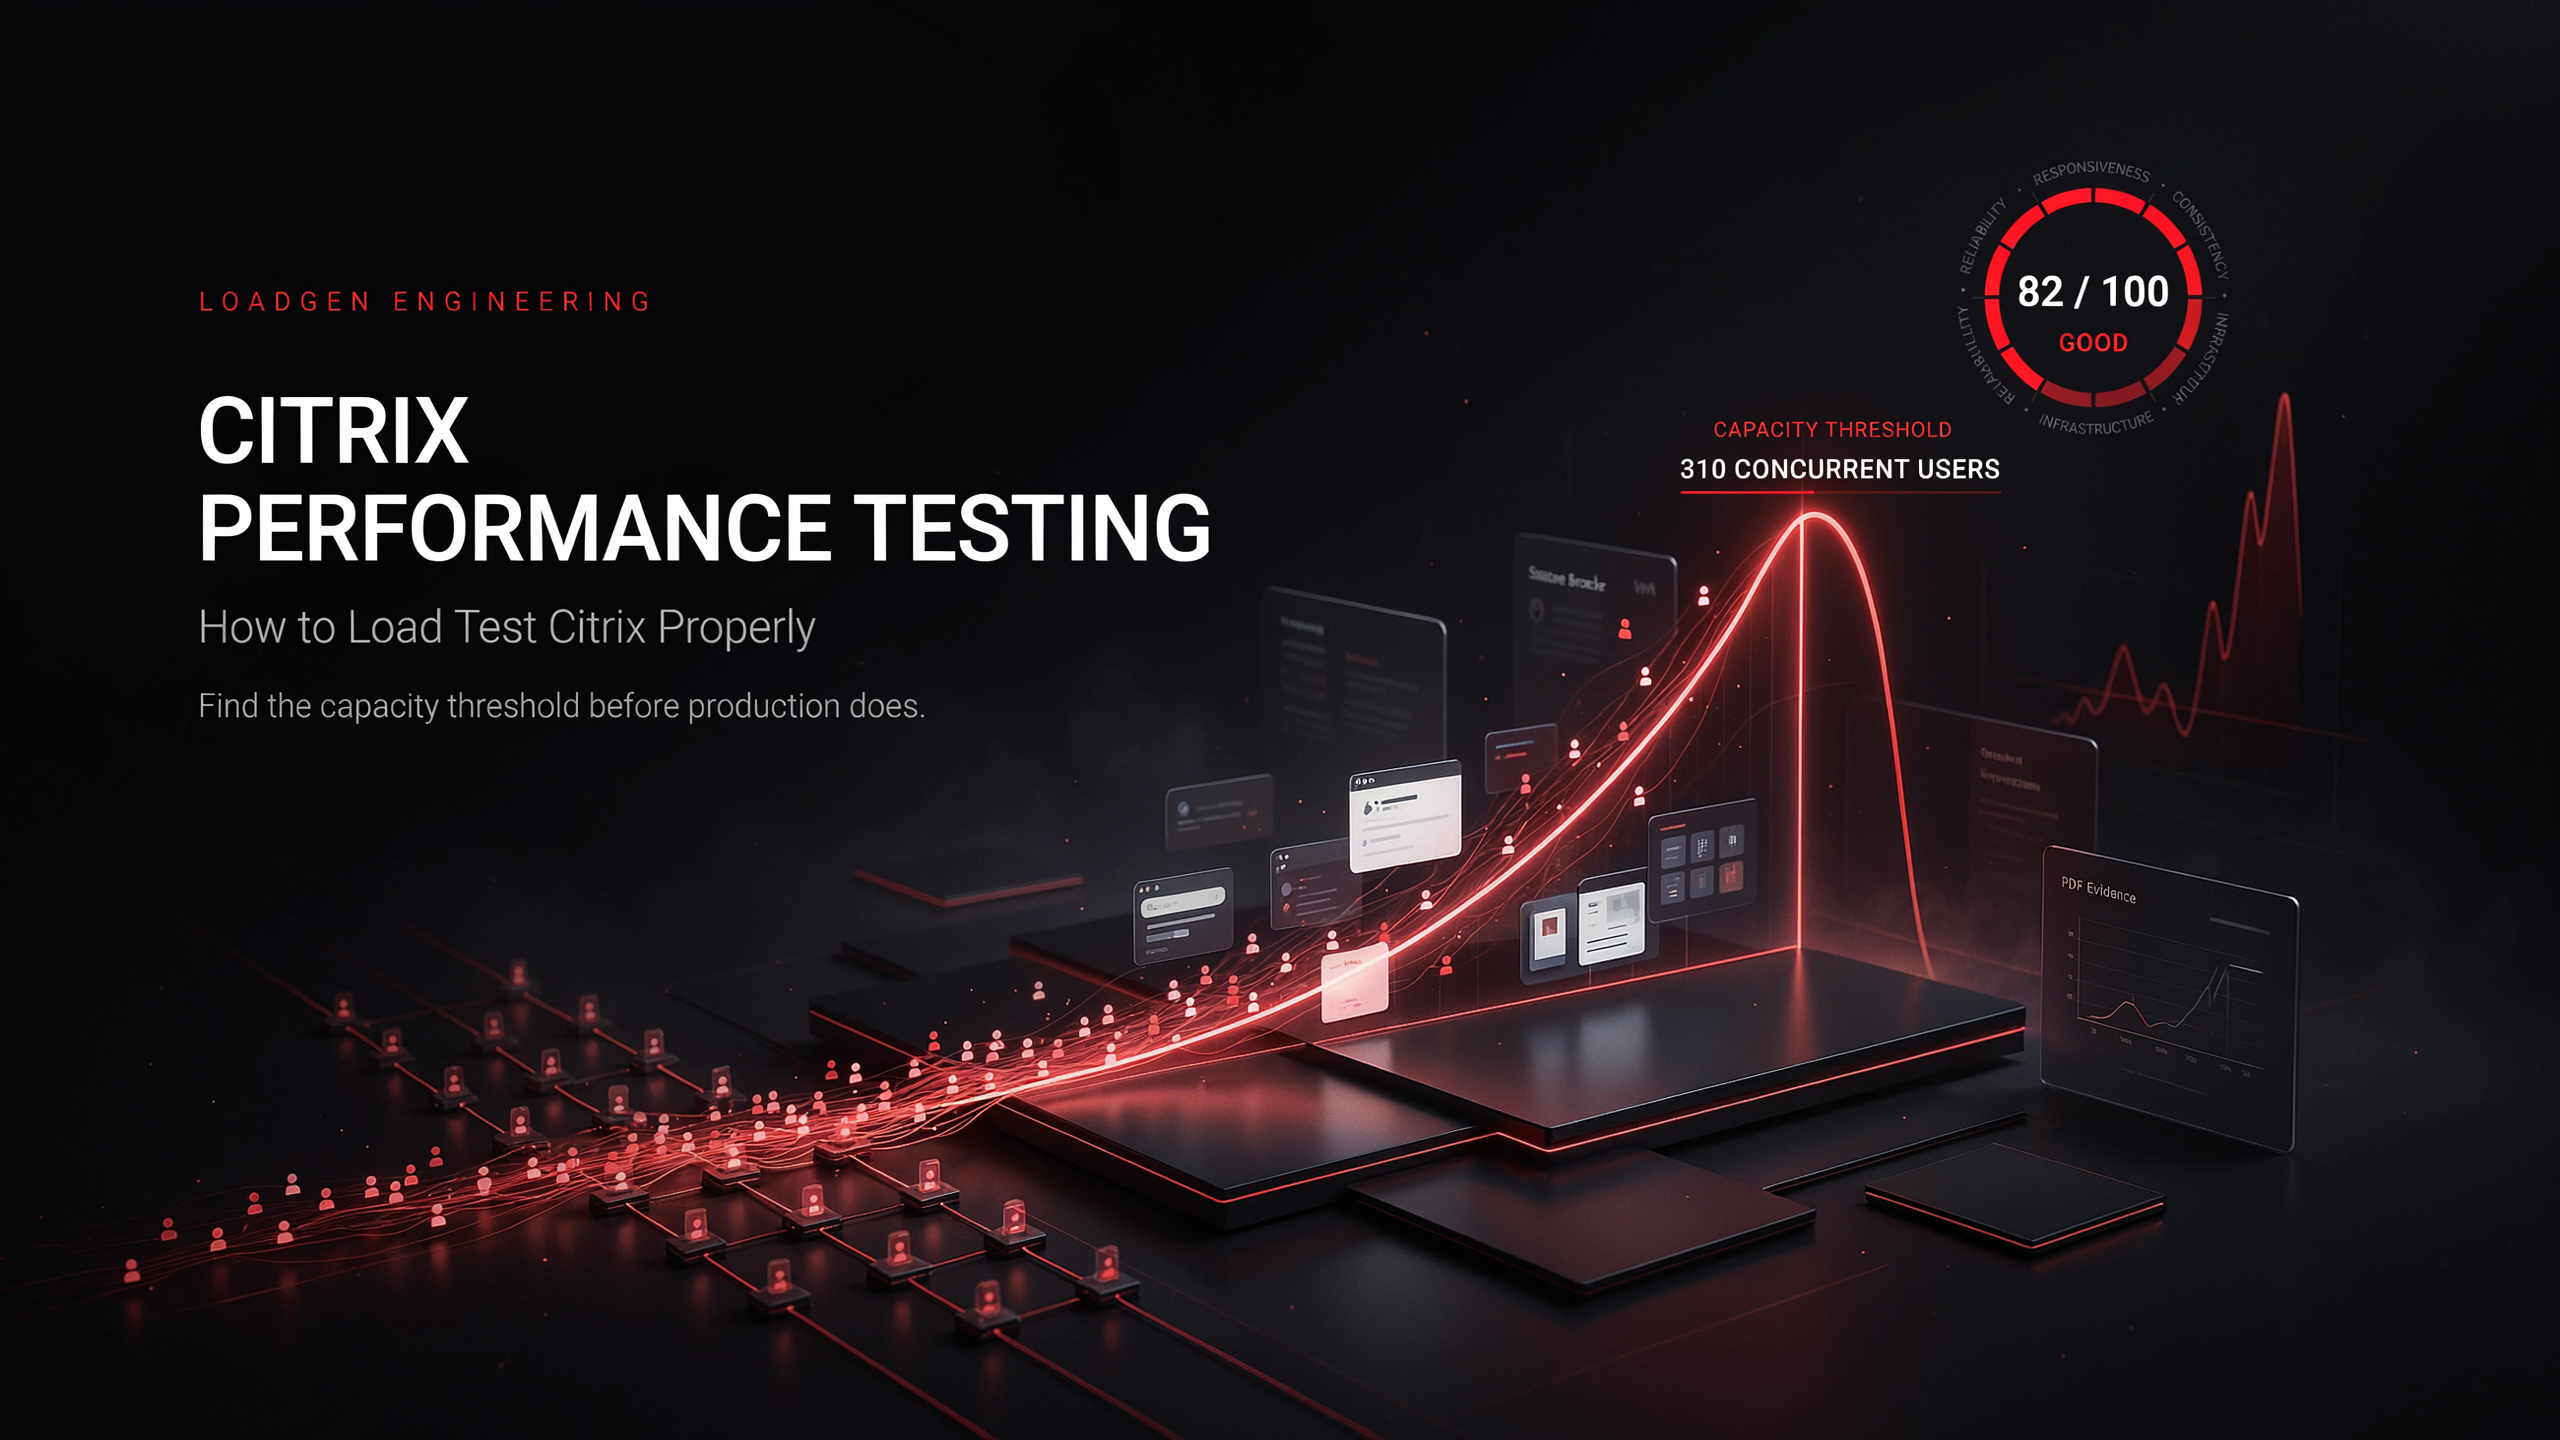
Citrix Performance Testing — How to Load Test Citrix Properly | LoadGen
How to load test Citrix: what to simulate, how to ramp, what to measure, and how to turn a run into a defensible "how many users fit" answer.
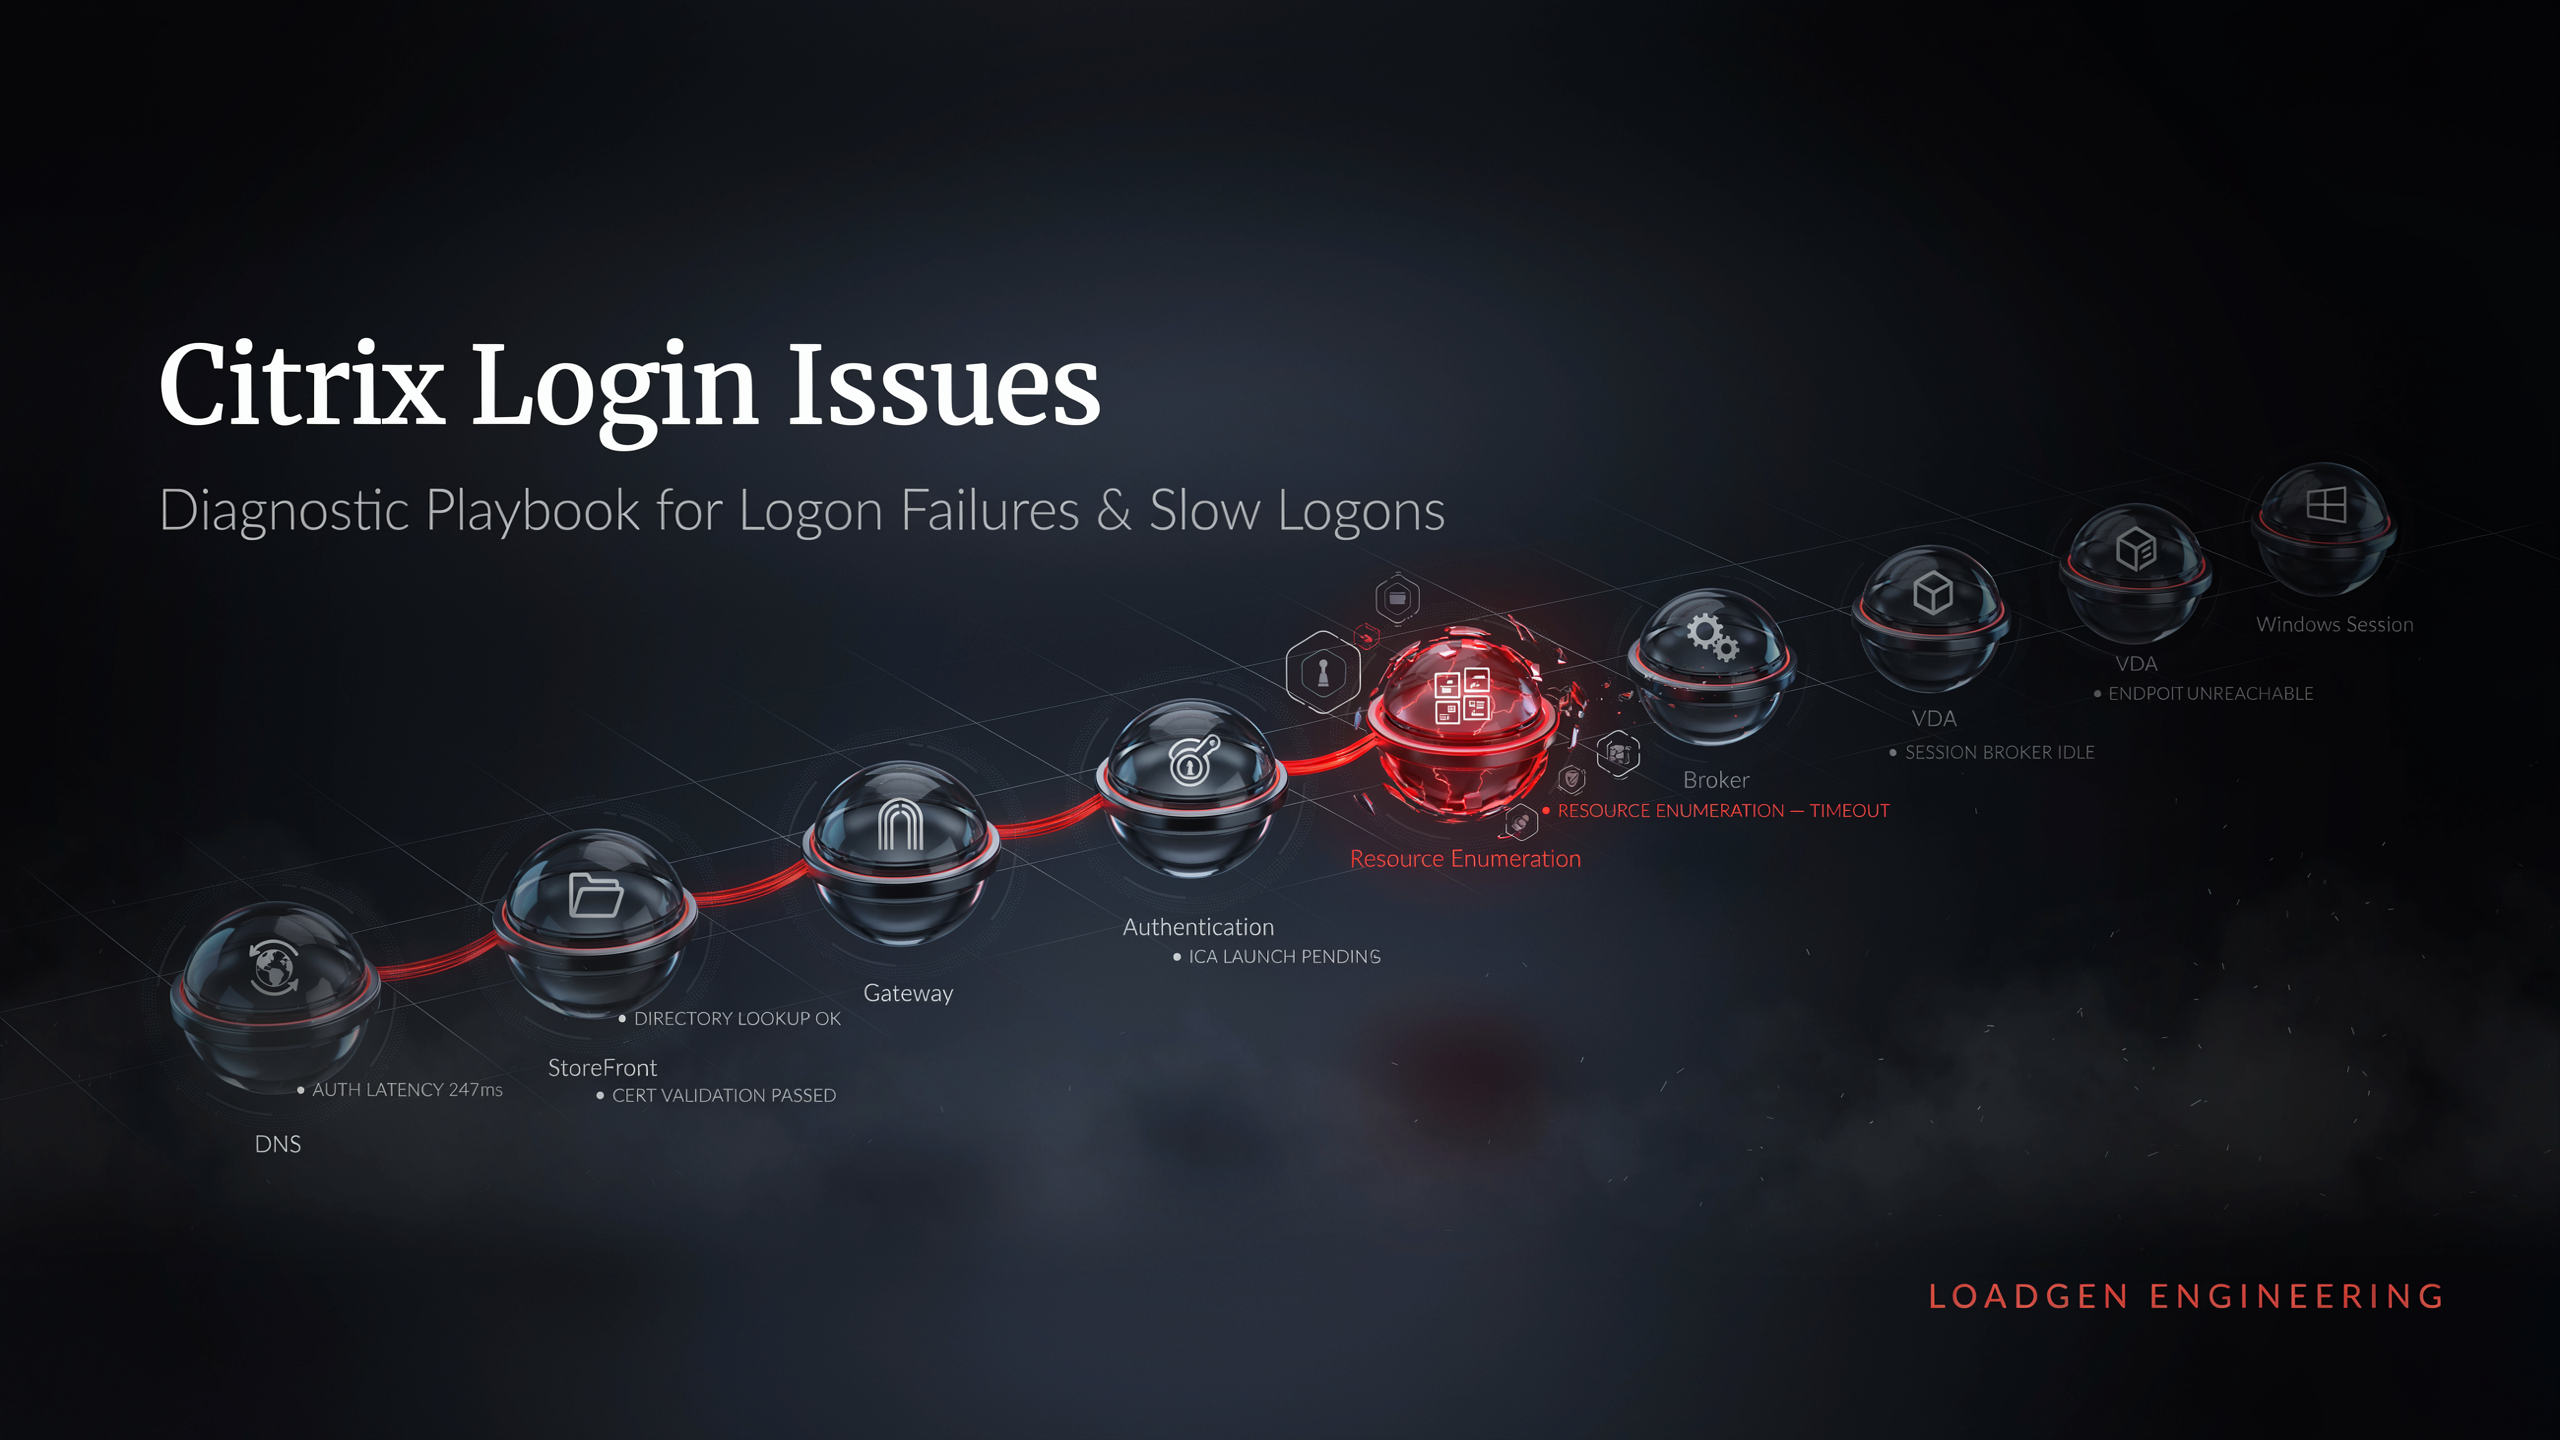
Citrix Login Issues — Diagnostic Playbook for Logon Failures & Slow Logons | LoadGen
Citrix not loading, logon failures, "failed to launch due to resource enumeration"? Work the logon chain step by step — and monitor it so you see the next one first.
Ready to baseline your environment?
Run the wizard, hit the cockpit, watch the audit trail build itself.
