Citrix Login Issues — Diagnostic Playbook for Logon Failures & Slow Logons | LoadGen
Citrix not loading, logon failures, "failed to launch due to resource enumeration"? Work the logon chain step by step — and monitor it so you see the next one first.
LoadGen Engineering
Product Strategy
"Citrix isn't loading" can break at seven different places, and each one leaves a different fingerprint. Here's how to find which link failed — and how to stop discovering it from a user.
First: which failure is it?
Before touching anything, put the report in one of three buckets. They have completely different causes:
| Bucket | What the user says | What it usually means |
|---|---|---|
| Can't authenticate | "It won't accept my password" | Auth chain: StoreFront, Gateway, MFA, directory |
| Logs in, nothing to click | "It's empty" / "my app is gone" | Resource enumeration — the store returned no resources |
| Clicks the icon, nothing happens | "It's not loading" / "it spins" | Launch: broker, ICA file, VDA availability, or the client |
| (fourth, quieter) | "It works, it's just slow" | Session logon: profile, GPO, scripts, drive/printer mapping |
Roughly: empty store = enumeration, spinning icon = launch, slow but works = logon phase. Getting this right in the first minute saves most of the call.
The logon chain, link by link
1. Name resolution and reachability
Before any Citrix component is involved, the client has to resolve and reach the store URL. Check: DNS resolution from the client network, not from your admin desktop. Split-brain DNS and a stale internal record account for a surprising share of "Citrix is down."
2. Certificate validity
An expired or incomplete certificate chain on Gateway or StoreFront produces failures that look like authentication problems. Check: expiry date and intermediate chain completeness. If the error only affects some clients, suspect the chain, not the leaf.
3. Authentication (StoreFront / Gateway / MFA)
Check: can the account authenticate directly against the directory? Is the MFA provider responding? Are there stale sessions or a locked account? On Gateway, check the auth policy order — an nFactor change is a classic Friday-afternoon regression.
4. Resource enumeration ← the "failed to launch due to resource enumeration" error
This is the step where the store asks the delivery controllers "what is this user allowed to see?" and builds the icon list. It fails or empties when:
- The Delivery Controllers are unreachable from StoreFront (service down, firewall, or an unhealthy controller left in the store configuration)
- Group membership changed — the user genuinely lost entitlement, or a group is out of scope
- Delivery group / machine catalog problems — no registered VDAs, maintenance mode left on
- The StoreFront store's controller list is stale after a farm change
- Trust / SPN issues between StoreFront and the controllers
Fastest test: authenticate as the affected user and check whether the store returns zero resources or some resources. Zero for everyone points at StoreFront-to-controller communication; zero for one user points at entitlement.
5. Launch — ICA file and broker
The icon is there, the click does nothing. Check: does the launch produce an ICA file? Does the broker have a registered, non-maintenance-mode VDA to hand out? Are all VDAs at max sessions? "Nothing happens" is very often "there is nothing to give you."
6. The connection itself
Client version mismatch, blocked ports, or a Gateway that authenticated fine but can't proxy the session. Check: client version against the environment, and whether internal (direct) connections succeed while external (via Gateway) fail — that split localises it immediately.
7. Windows logon inside the session
This is the "works but takes two minutes" bucket: profile load, GPO processing, logon scripts, drive and printer mapping. Check: which phase is long. A profile that grew, a script waiting on an unreachable share, or a printer mapping timing out will each dominate a different phase.
Why you found out from a user
Every one of those links can be failing right now, and an availability dashboard will stay green. The endpoint answered. The service is "up". Nobody measured whether a person could actually get to their application.
That is the gap: infrastructure monitoring watches components; users experience a chain. The only way to know the chain works is to walk it — on a schedule, from where the user sits.
See it coming next time
The practical fix is a synthetic session that does exactly what a user does, on a schedule, and times every step separately.
Monitor the chain end to end. A LoadGen end-to-end monitoring profile signs in through the real path — StoreFront, Gateway, PNAgent or an external login flow — enumerates resources, launches the application and times each step. When authentication triples or enumeration returns nothing, you get an alert with the step name on it, not a generic "site down".
Note the enumeration detail: resource enumeration isn't an afterthought — when you build a Citrix profile, the wizard can fetch the store's resources directly from StoreFront to pick what you test. The same enumeration call that breaks in production is a first-class step in the monitor.
Watch the components underneath, too. Uptime checks cover the pieces the chain depends on: the StoreFront/Gateway URL, DNS resolution, the certificate chain (with SSL-expiry alerting, which prevents link 2 entirely), and the back-end APIs the desktop needs.
Prove the chain before a big day. A Session Canary runs a small real probe session on a schedule, so a broken logon chain surfaces before your test campaign — or before Monday's login storm.
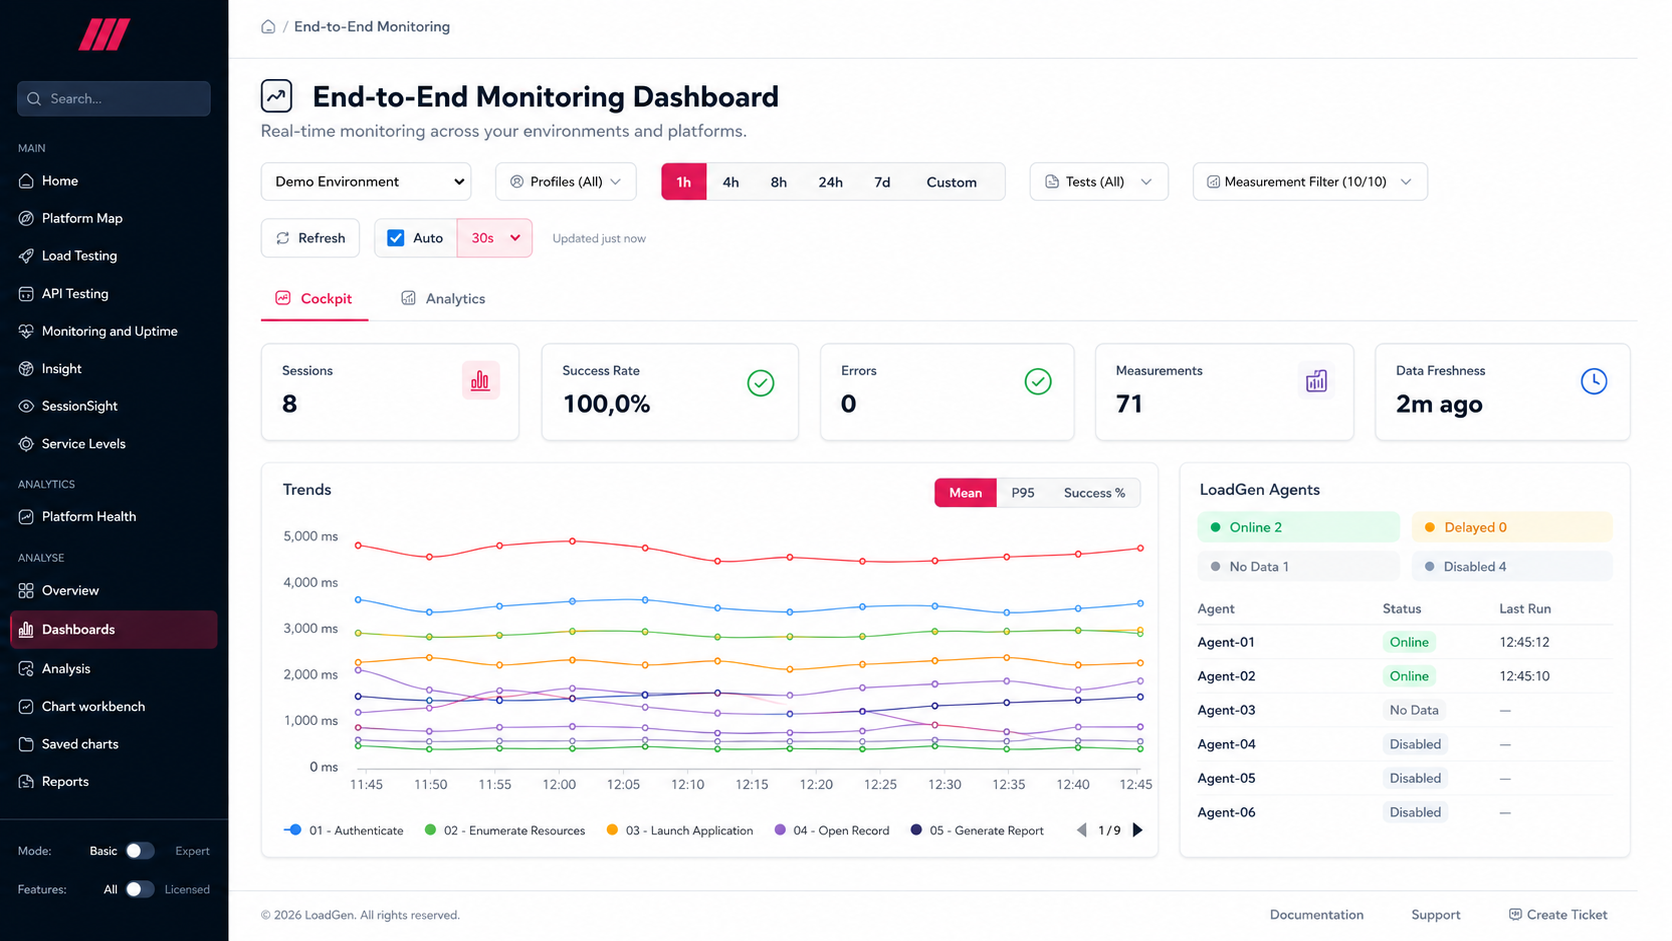 Per-step measurements over time with Mean / P95 / Success % toggles, plus a per-agent status panel (Online / Delayed / No Data / Disabled). This is what tells you authentication grew 4× while everything else held.
What "good" looks like
| Practice | Why it works |
|---|---|
| Measure each step, not "logon time" | A single number tells you it's slow; per-step tells you what to fix |
| Baseline before thresholds | Run for a week first — alerting on a guess creates noise, and noise gets muted |
| Alert on degraded, not just failed | The 4× authentication slowdown is the early warning for tomorrow's outage |
| Cover the dependencies | DNS, certificate and controller reachability are the three most common root causes and the three cheapest checks |
Honest scope note
LoadGen measures the chain the way a user experiences it: real sessions through the real client, with each step timed, plus generic response-time percentiles and any Windows performance counters you bind to the run. It does not read Citrix-internal protocol telemetry. For most login problems that's not a limitation — the answer is which step broke and when it started, and that's exactly what step timings give you.
Find the broken link before the phone rings
Put a real session on the schedule, time every step, and alert on the step — not the symptom.
Related reads
Keep reading.
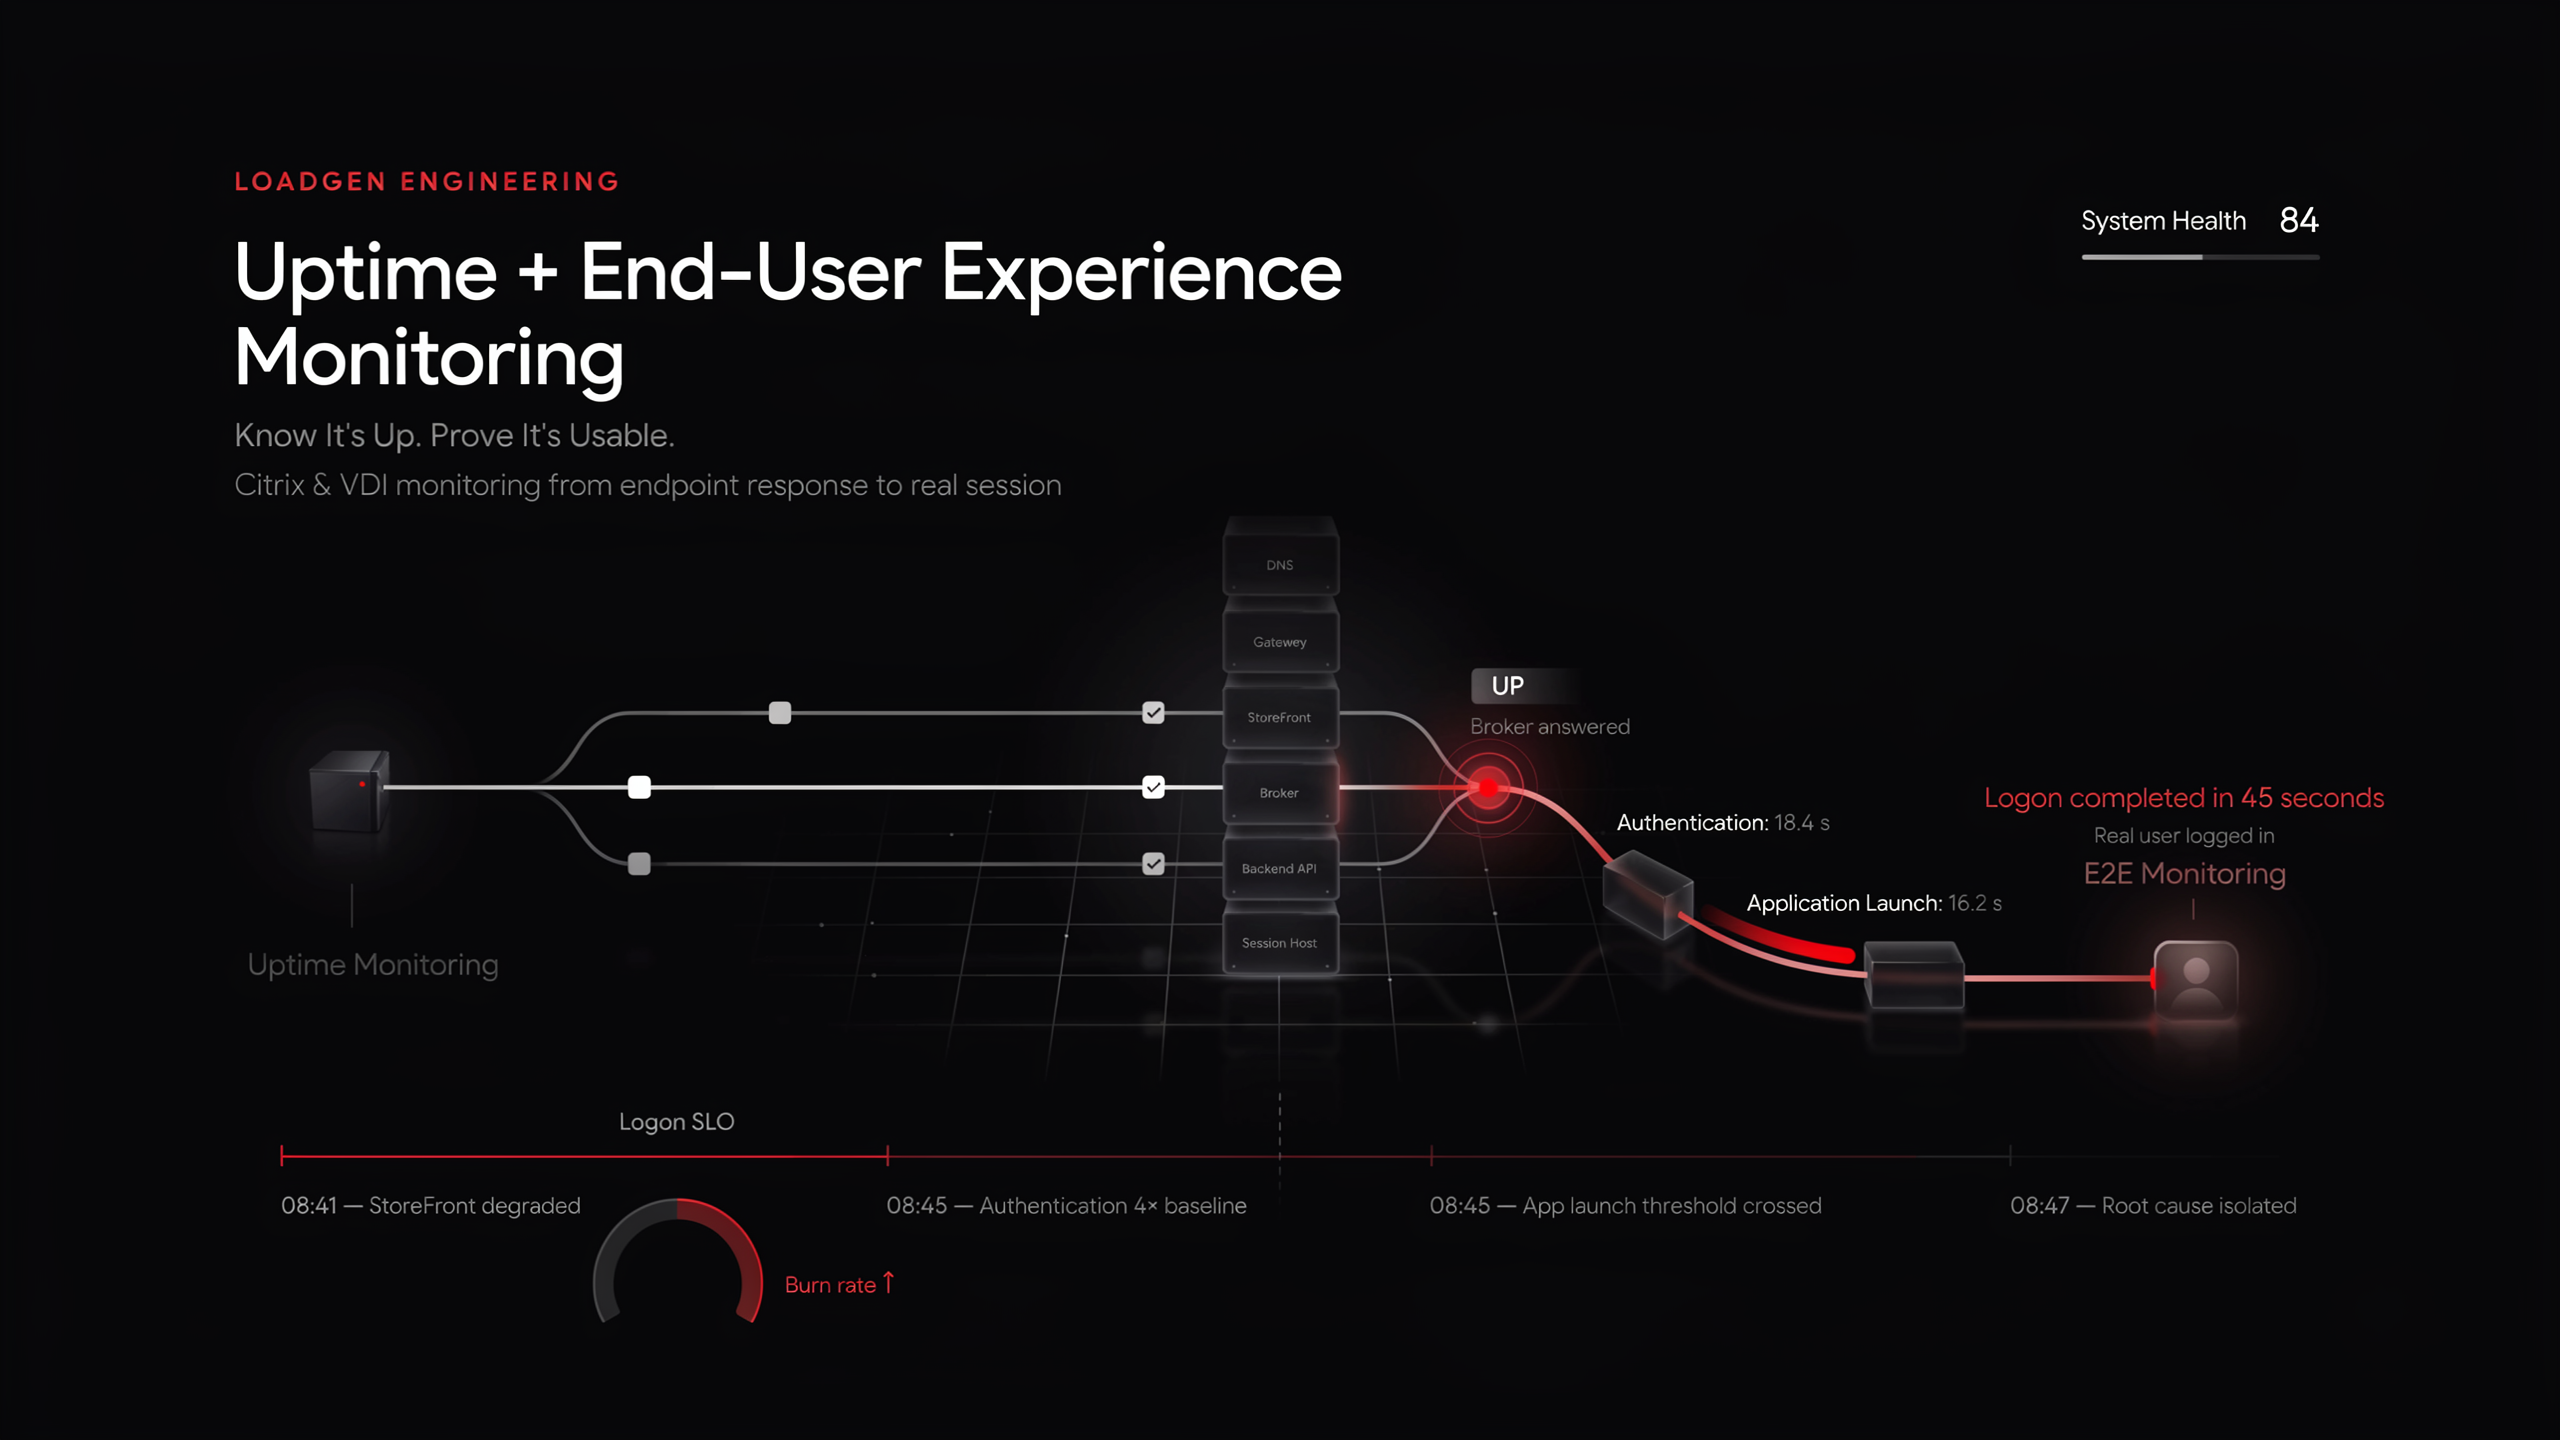
Uptime Monitoring + End-User Experience Monitoring for Citrix & VDI | LoadGen
Uptime says the broker answered. End-to-end monitoring says a real user logged in — in 45 seconds. Why VDI needs both, and how to run them on one platform.
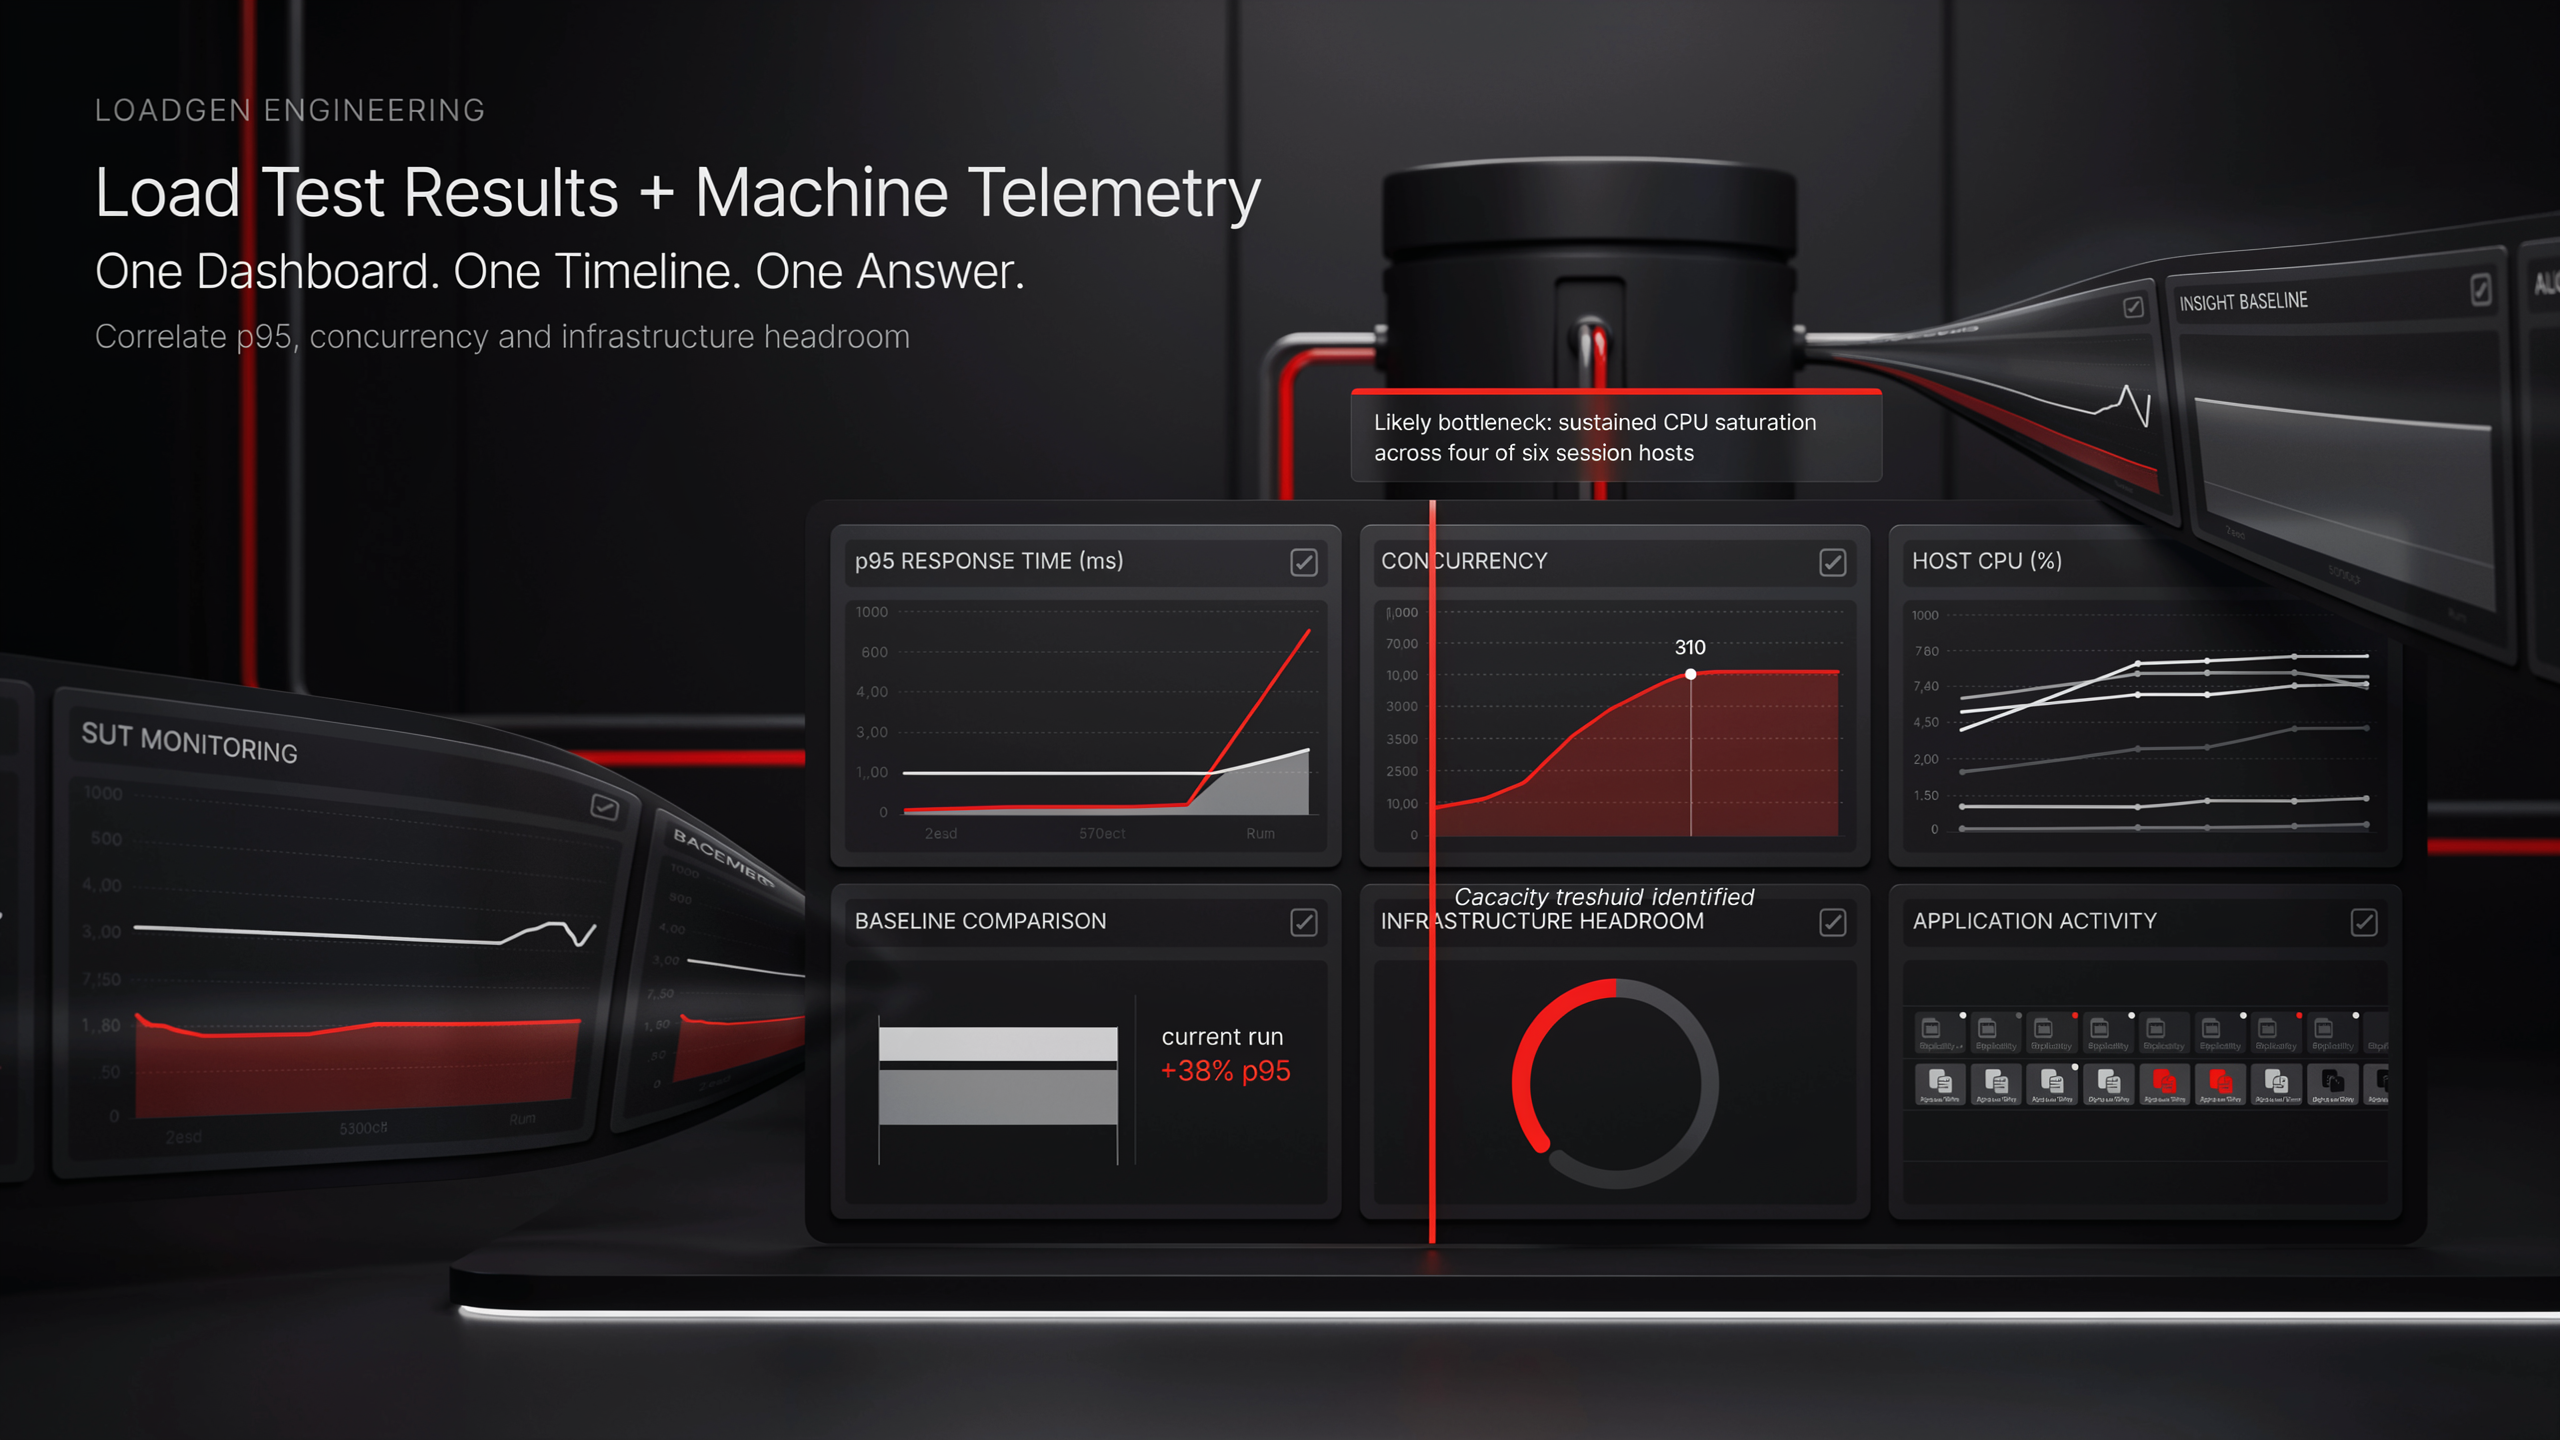
Combine Machine Telemetry with Load Test Results in One Dashboard | LoadGen
Load tests tell you p95 went up. Machine telemetry tells you why. Build one dashboard over both — in LoadGen Analyse with AI, or in Grafana over the same InfluxDB.
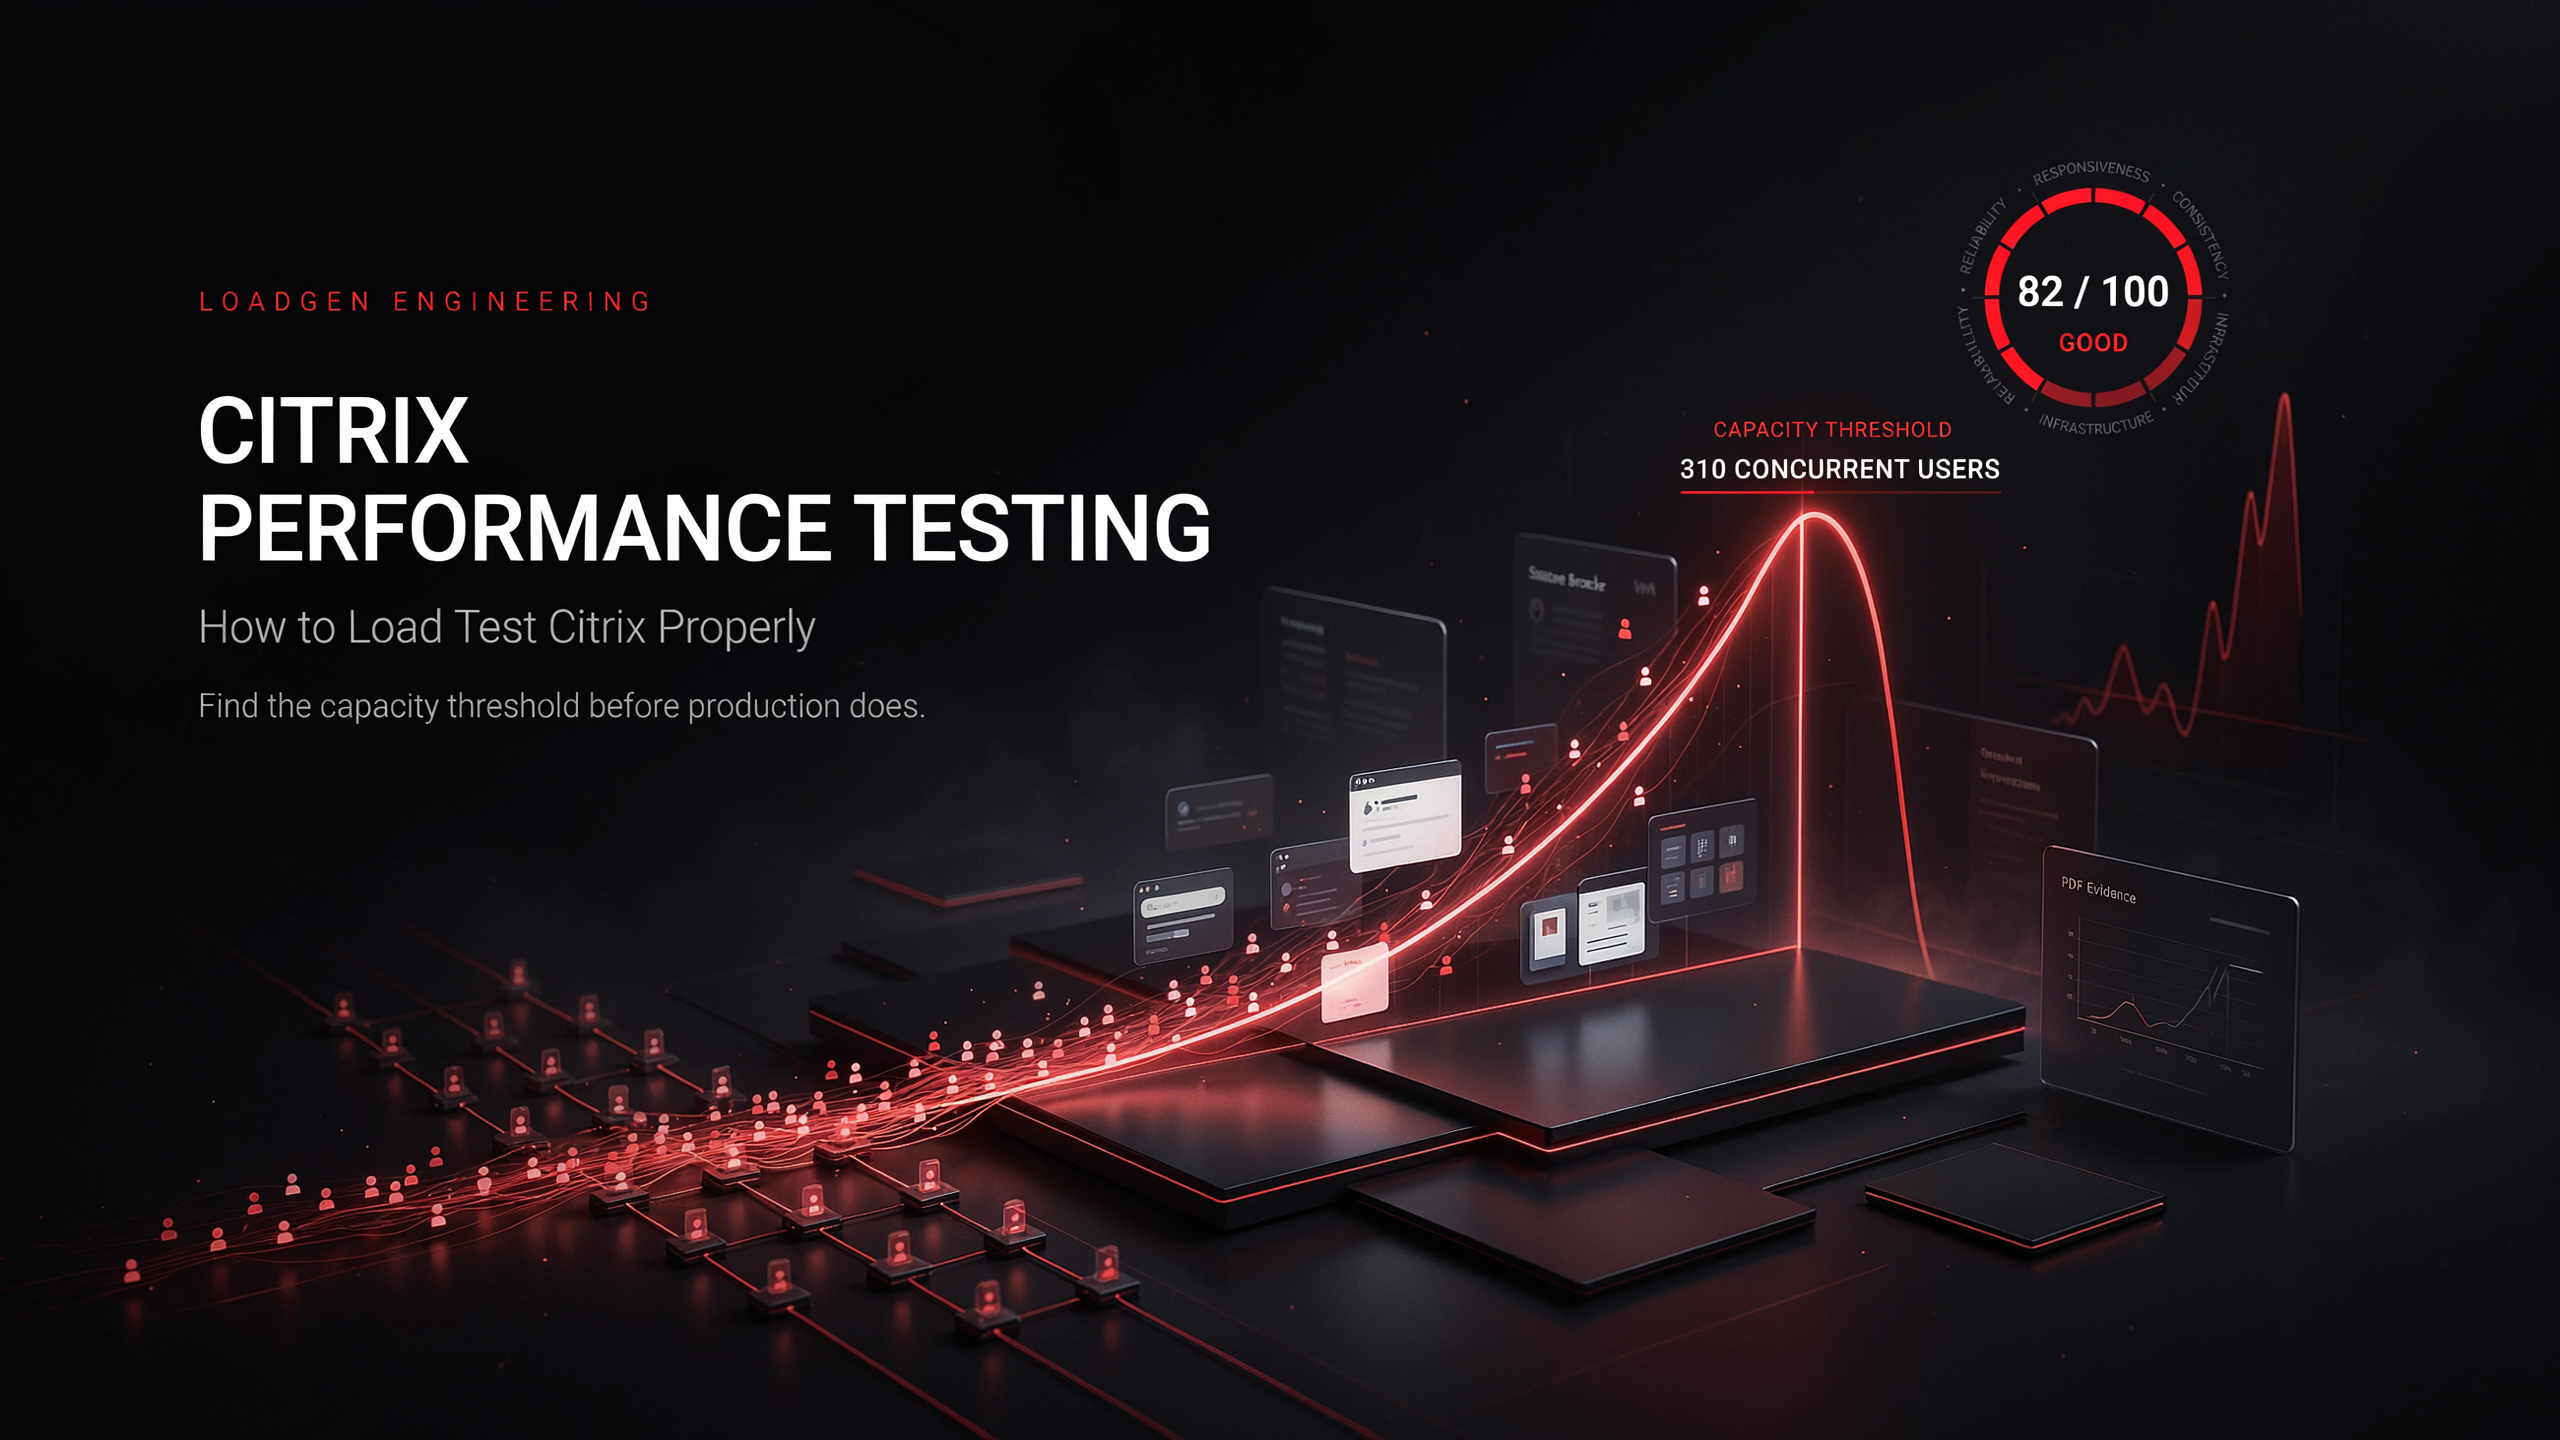
Citrix Performance Testing — How to Load Test Citrix Properly | LoadGen
How to load test Citrix: what to simulate, how to ramp, what to measure, and how to turn a run into a defensible "how many users fit" answer.
Ready to baseline your environment?
Run the wizard, hit the cockpit, watch the audit trail build itself.
