Citrix Performance Testing — How to Load Test Citrix Properly | LoadGen
How to load test Citrix: what to simulate, how to ramp, what to measure, and how to turn a run into a defensible "how many users fit" answer.
LoadGen Engineering
Product Strategy
A synthetic benchmark tells you how a benchmark performs. A proper Citrix load test tells you how your applications behave at your concurrency — and how many users actually fit.
What a Citrix test has to prove
Four questions come up in every capacity conversation. A test is only useful if it answers them:
- How many concurrent users can this environment carry before the experience degrades?
- Did this change make it worse? — Windows patches, a new Workspace app version, a GPU driver, an application release.
- Is the logon storm survivable? Monday 08:45 is a different workload from Tuesday 14:00.
- Can I show someone the evidence? A number in a spreadsheet loses to a report with a baseline.
Anything that doesn't answer these is a demo, not a test.
Test your applications, not a benchmark
This is the fork in the road. Some tools score an environment by injecting purpose-built benchmark programs — a CPU loop, a disk loop, a text-editor stand-in — and averaging their timers. It's fast, and it's reproducible, and it tells you very little about the ERP client your finance team actually uses.
The alternative is to drive your own applications. Record the real workflow — open the app, search a customer, open a record, generate the document — and replay it as the test. Every number then refers to something a person actually does. When the score moves, you can point at the transaction that moved it.
Step 1 — Build the profile
LoadGen uses a dedicated 7-step Citrix wizard rather than a generic template, because Citrix has choices no generic tool models:
- Protocol mode — Basic (ICA) or Enhanced (HDX)
- Connection path — StoreFront, Gateway, PNAgent or an external login flow, matching how your users actually connect
- Resource selection — fetch the published resources straight from the store and pick what you test
- Display and session settings, then agent strategy
The workload itself is a version-controlled .lgs script recorded in LoadGen Studio and executed by Full Agents — the Windows agents that drive real fat-client sessions.
Practical advice: start with one representative workflow from the loudest department. A perfect test of the wrong application is worthless; a decent test of the right one changes decisions.
Step 2 — Design the ramp
Load shape is where most homegrown tests go wrong. The scenario designer gives you four phase types — Idle, Ramp-Up, Sustain, Ramp-Down — and you want different shapes for different questions:
| Question | Shape |
|---|---|
| How many users fit? | Long, linear ramp-up. Keep adding users and watch where the curve bends. |
| Can we survive Monday? | Steep ramp — a login storm — then sustain. |
| Does it hold all day? | Modest ramp, very long sustain. Memory leaks and profile bloat only show up over hours. |
| Did the change hurt? | Identical shape to the previous run. Same shape, different build — that's the whole point. |
Need several user types in one run — task workers and power users — use scenario 'Included' phases to combine profiles into a single execution instead of running them separately and hand-merging results.
Step 3 — Get agents without building infrastructure
The most common reason a Citrix load test slips is not the test — it's the launcher estate. Ten Windows VMs, each needing the right Workspace app version, each drifting.
A Launcher Appliance removes that: import one VM image, enroll it with a token, approve it, and it brings its own agents — with pinned client versions so tests stay reproducible, central updates, and preflight checks that go green before you start.
Read next: Launcher Appliance
Step 4 — Watch it live, then read the score
While the run executes, the live cockpit streams concurrency, errors per second, phase progress and agent utilisation — and you can pause, resume or stop. Watching the first ramp live is how you catch a broken workload in minute three instead of hour two.
When the run finishes, it carries a LoadGen Score: one 0–100 number (also shown 0–10) with a word verdict, computed from your own transactions. Five weighted measures sit underneath it — Reliability, Responsiveness, Consistency, Trend vs baseline, and Infrastructure — and every one opens down to the samples and arithmetic behind it.
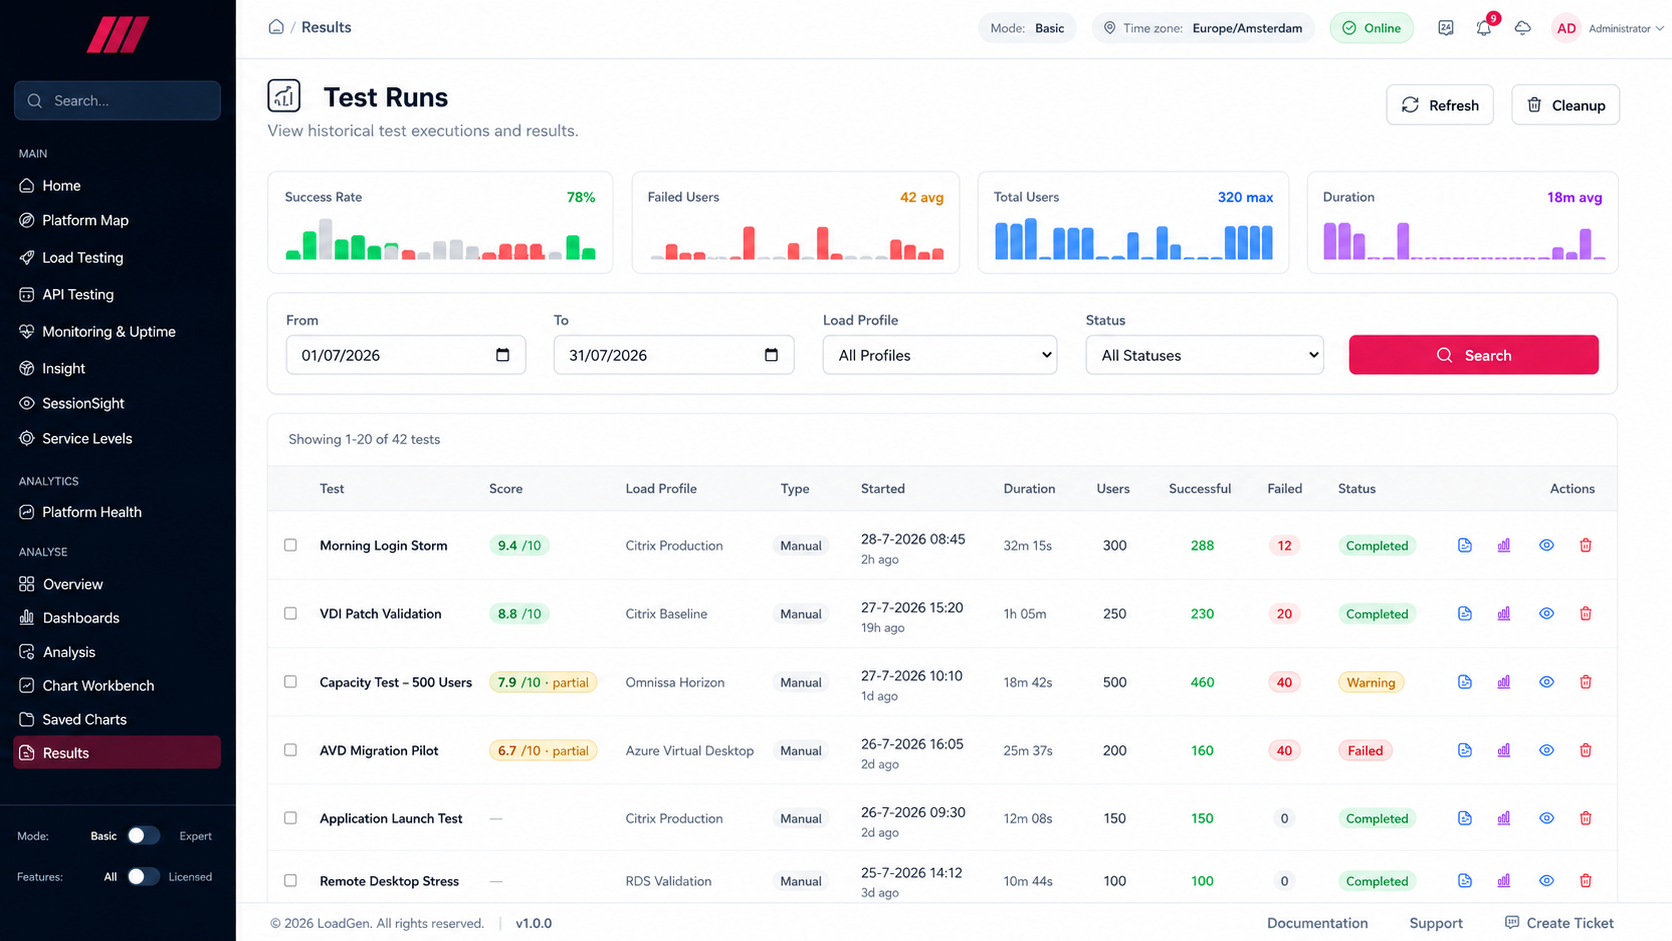 Every run in the grid carries its score (
8.2 /10 on the completed run; interrupted runs are marked partial rather than scored as if complete).
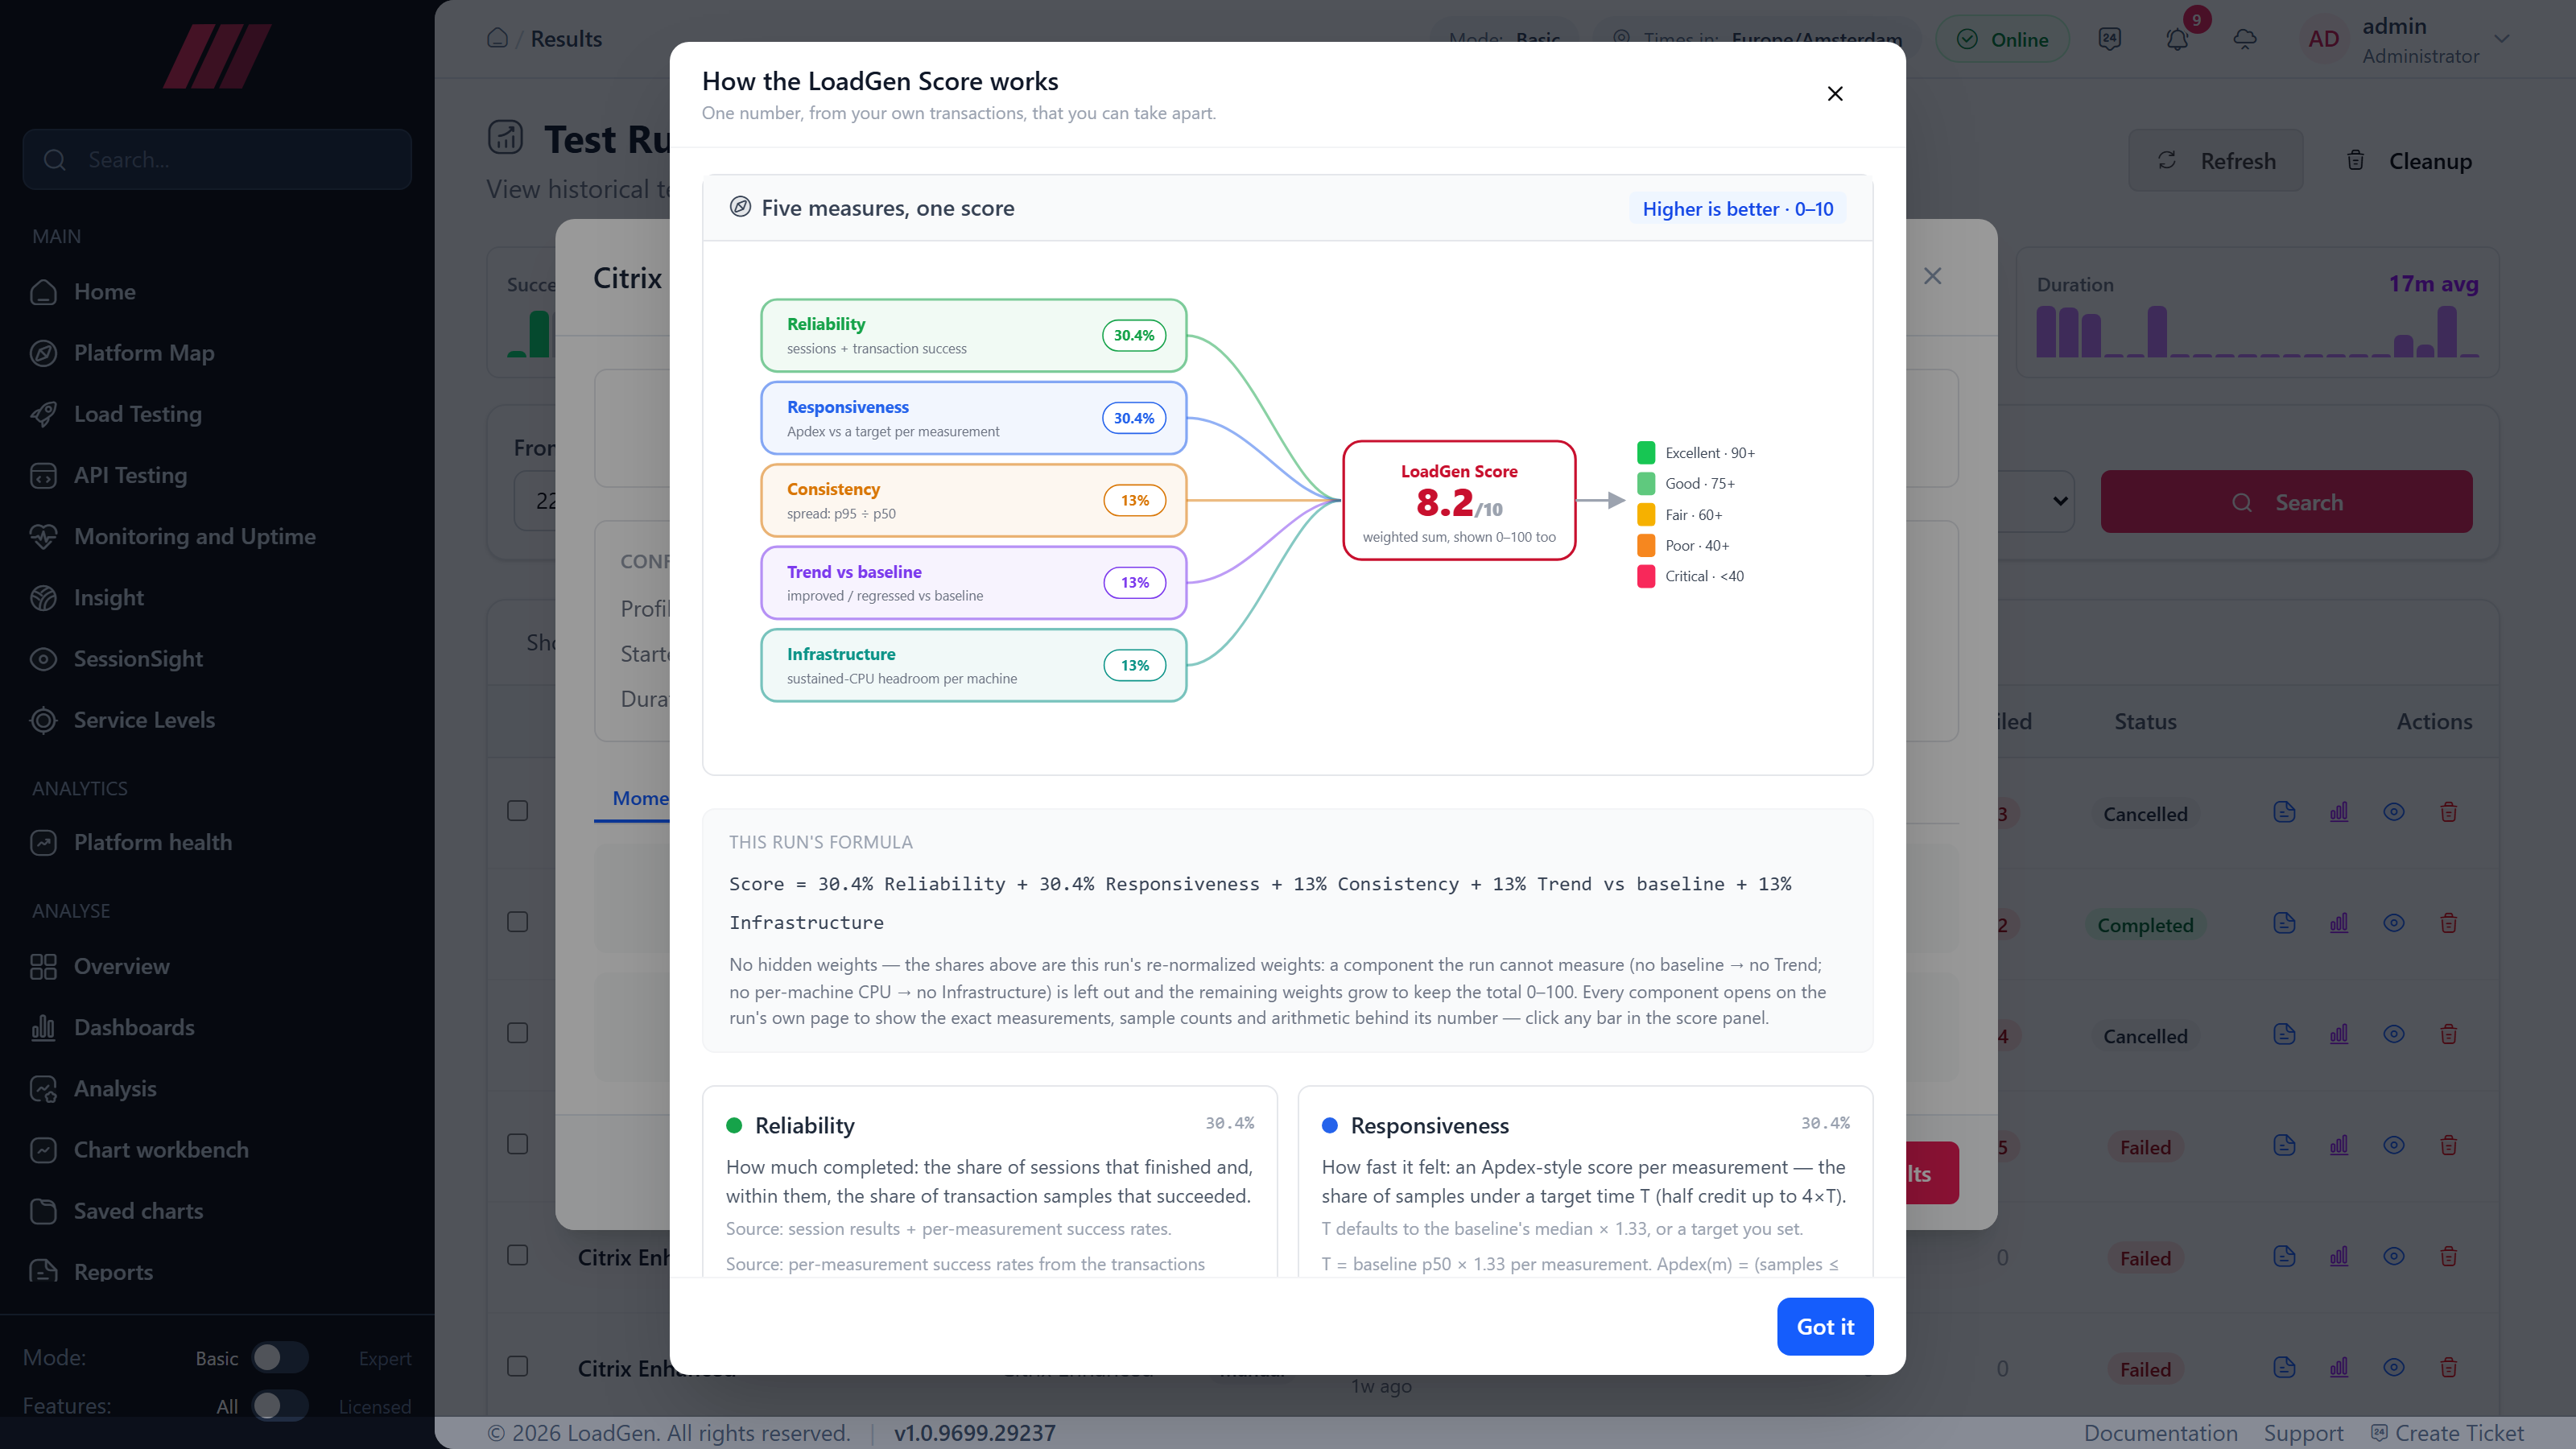 The in-product explainer: five measures with this run's re-normalised weights, the verdict bands (Excellent 90+ → Critical <40), and "THIS RUN'S FORMULA" spelled out. No hidden weights: a measure the run can't compute is dropped and the rest re-normalise.
Step 5 — Turn the score into a capacity answer
A score on its own is a grade. The useful move is converting it into a threshold answer:
"Pick the measurement that matters — logon time, or the score itself — set the level you're willing to accept, then ramp until you cross it. The concurrency at that crossing is your capacity number."
That is what a sizing conversation actually needs: not "the environment scored 82", but "experience holds to 310 concurrent users on this hardware; beyond that logon time leaves the acceptable band." Same run, same data — expressed as a decision.
Do it once and it also becomes your regression gate: the next build either holds the same concurrency at the same score, or it doesn't.
Step 6 — Hand over the evidence
Every finished run offers Generate PDF report in one click. The built-in template is preselected, the previous finished run of the same profile is auto-suggested as the baseline, and the PDF previews inline before you share it.
The report leads with the Score and verdict, then the test configuration, headline metrics and per-measurement results in friendly names and units — with improved / regressed columns when a baseline is set. Clone the template to add your own sections or branding.
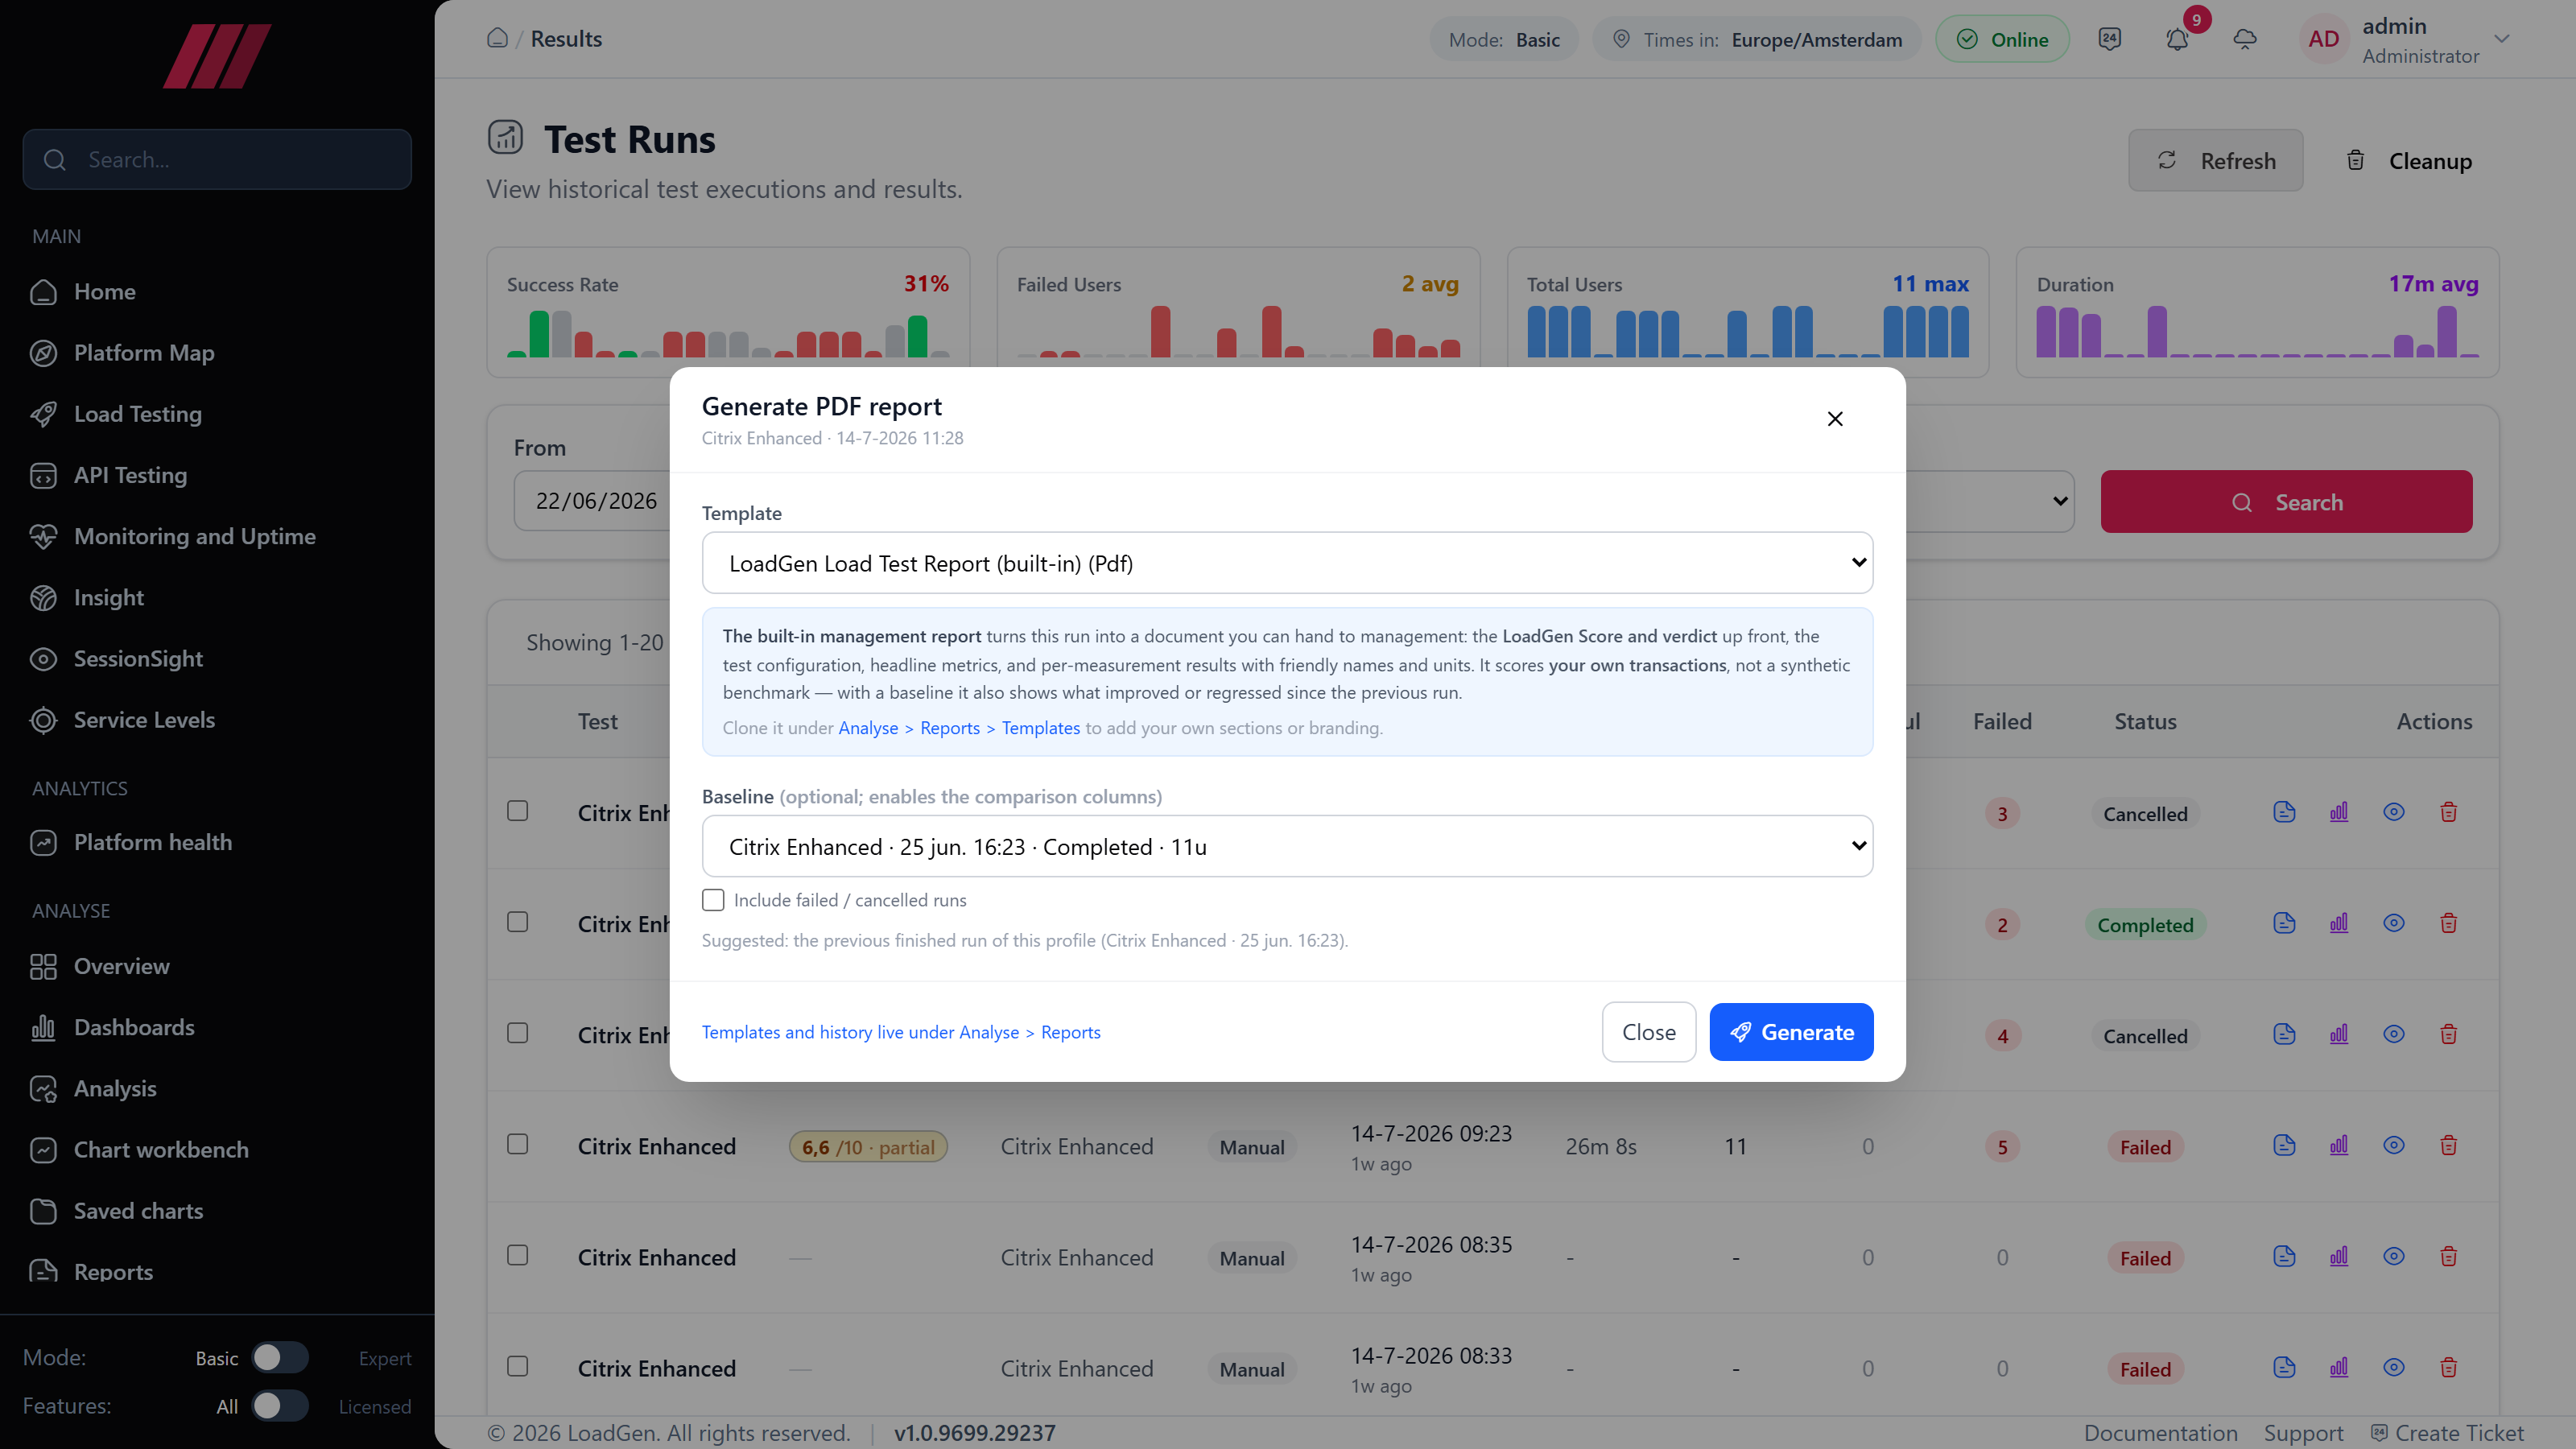 One click from the run summary: built-in management report preselected, baseline auto-suggested from the previous finished run of the same profile.
Mistakes worth avoiding
- Testing without a baseline. The first run is a number; the second run is information. Always keep a reference run.
- Changing two things at once. New image and new client version means you learn nothing about either.
- Testing at 100% of expected load only. You need the shape of the curve, not one point on it — otherwise you can't tell how close to the edge you are.
- Ignoring the infrastructure side. If you don't bind performance counters to the run, you'll know the experience degraded but not whether you'd run out of CPU. (See: combining telemetry with test results.)
- Treating the logon storm as an edge case. For most Citrix estates it is the peak.
Test Citrix with your applications, not a benchmark
Build the profile, ramp until it bends, read the score, hand over the report — all on one platform.
Related reads
Keep reading.
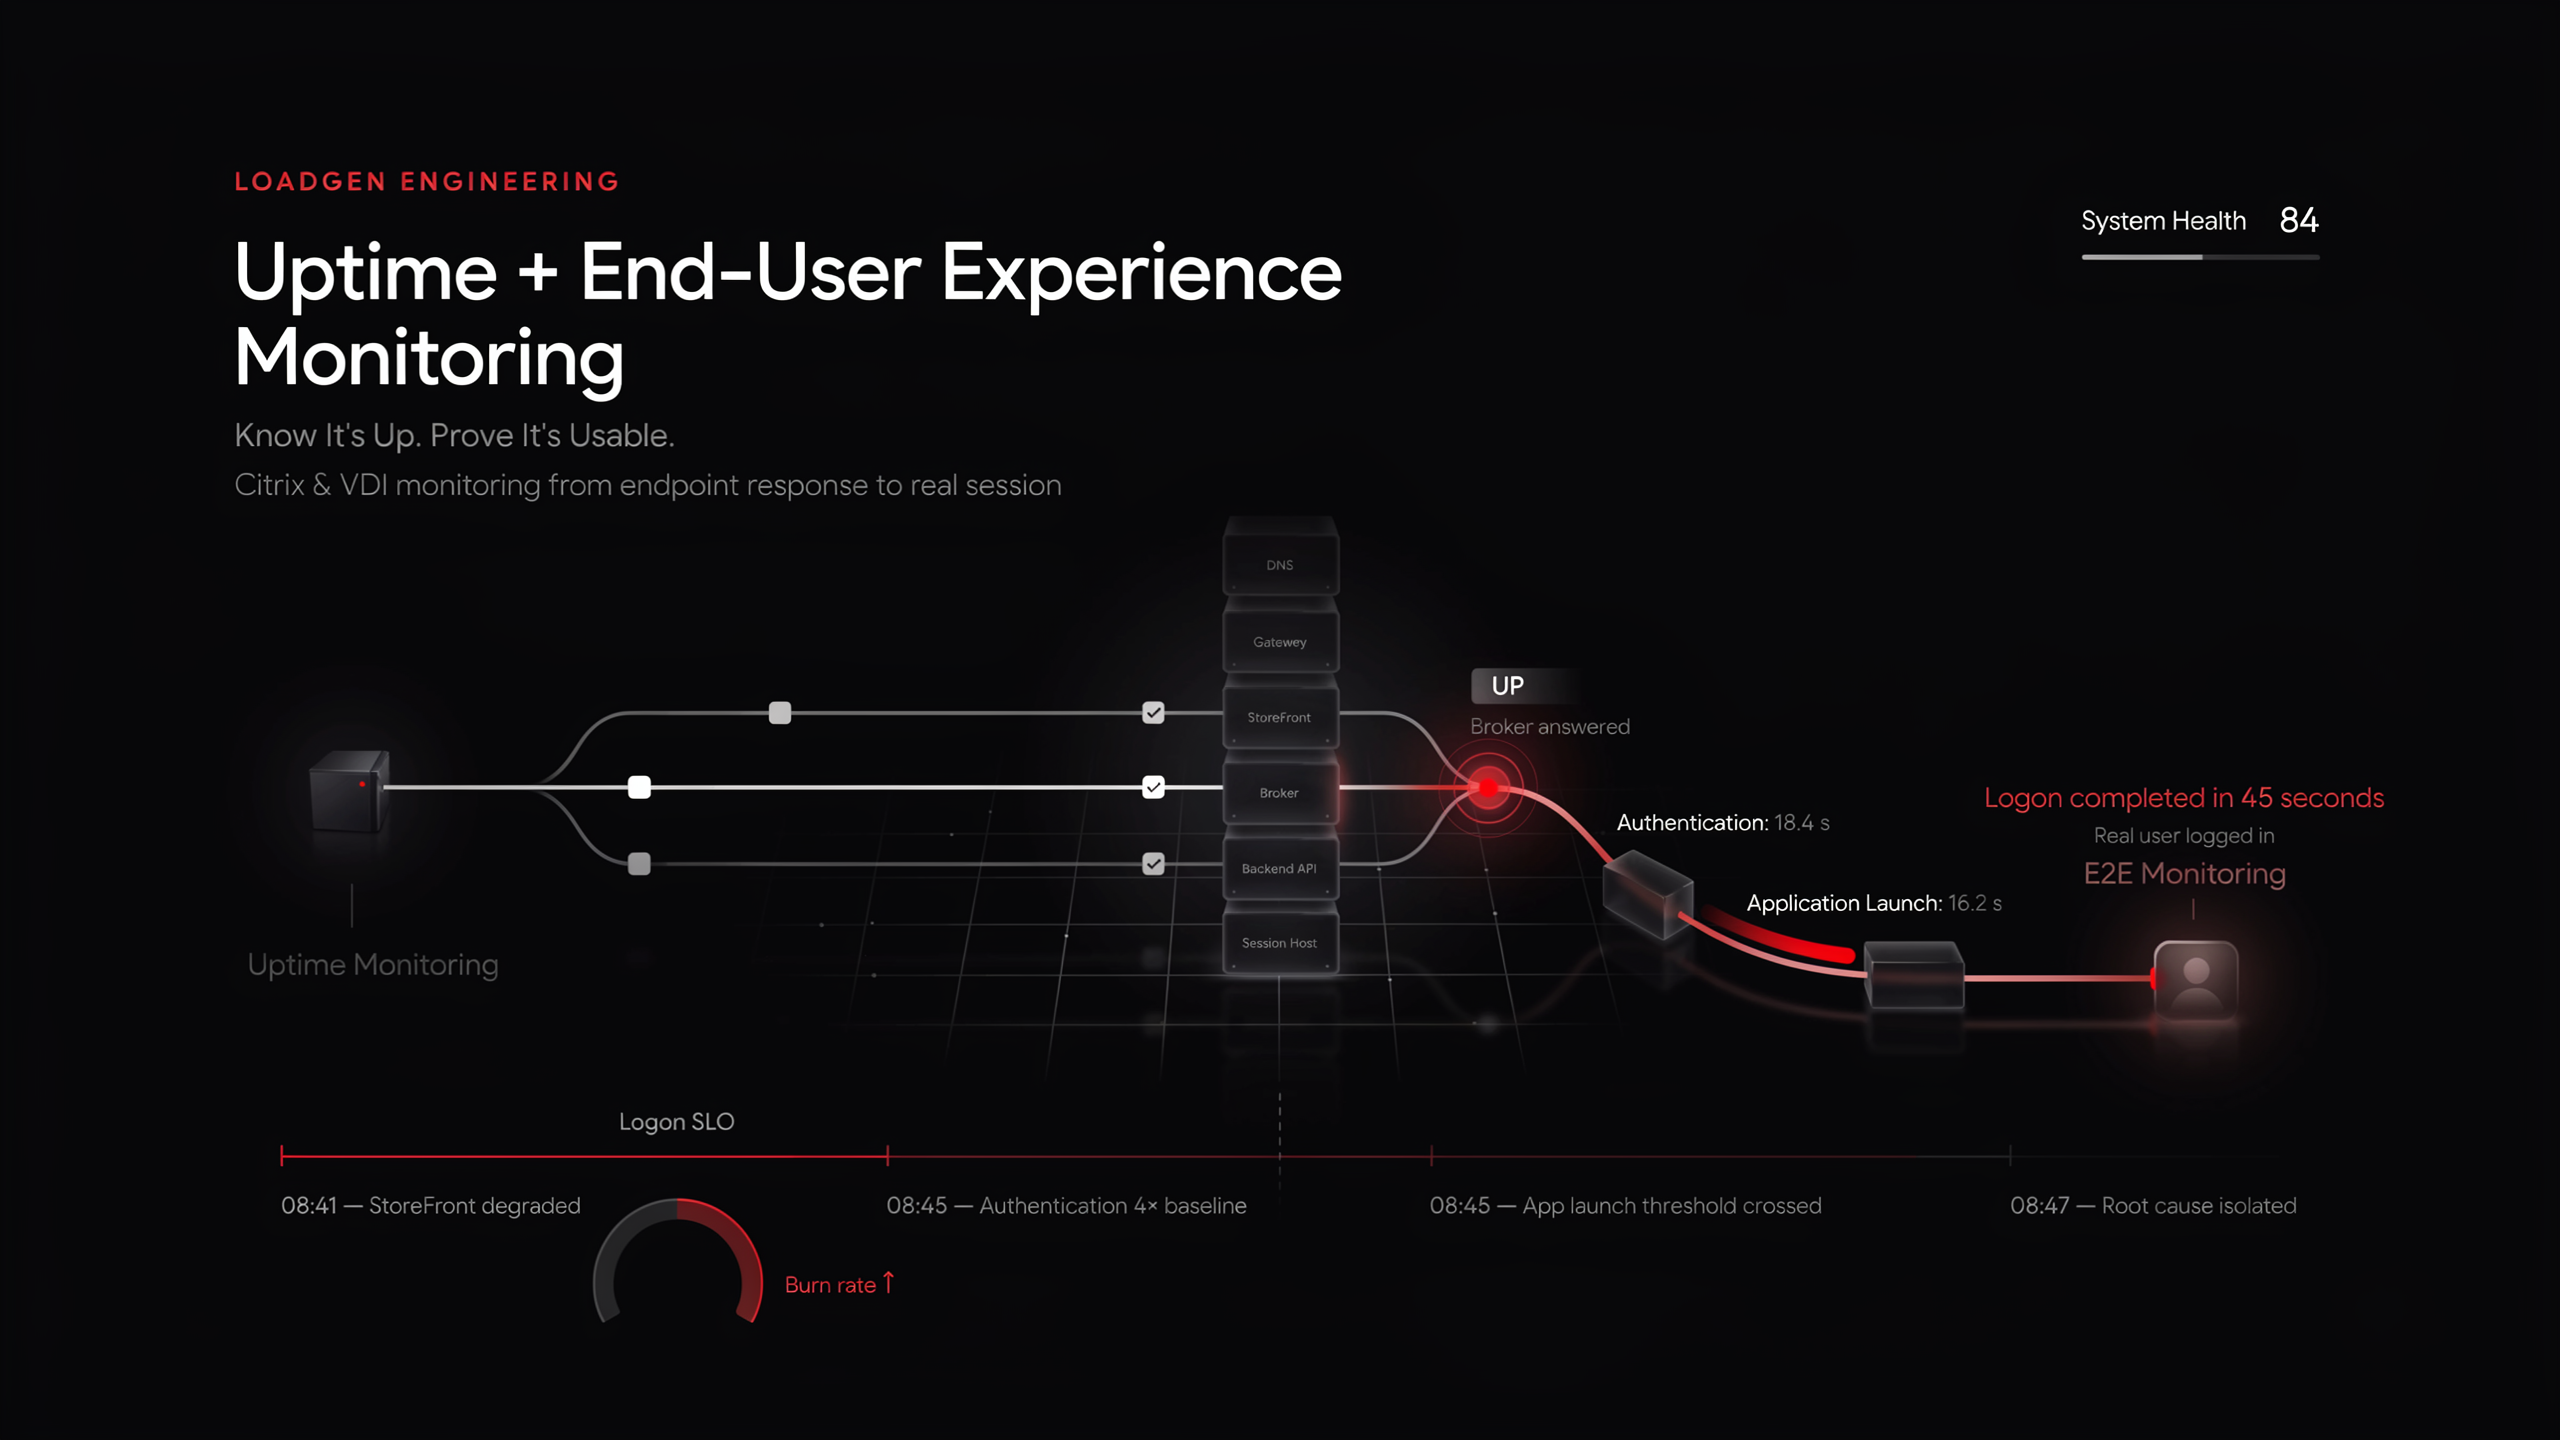
Uptime Monitoring + End-User Experience Monitoring for Citrix & VDI | LoadGen
Uptime says the broker answered. End-to-end monitoring says a real user logged in — in 45 seconds. Why VDI needs both, and how to run them on one platform.
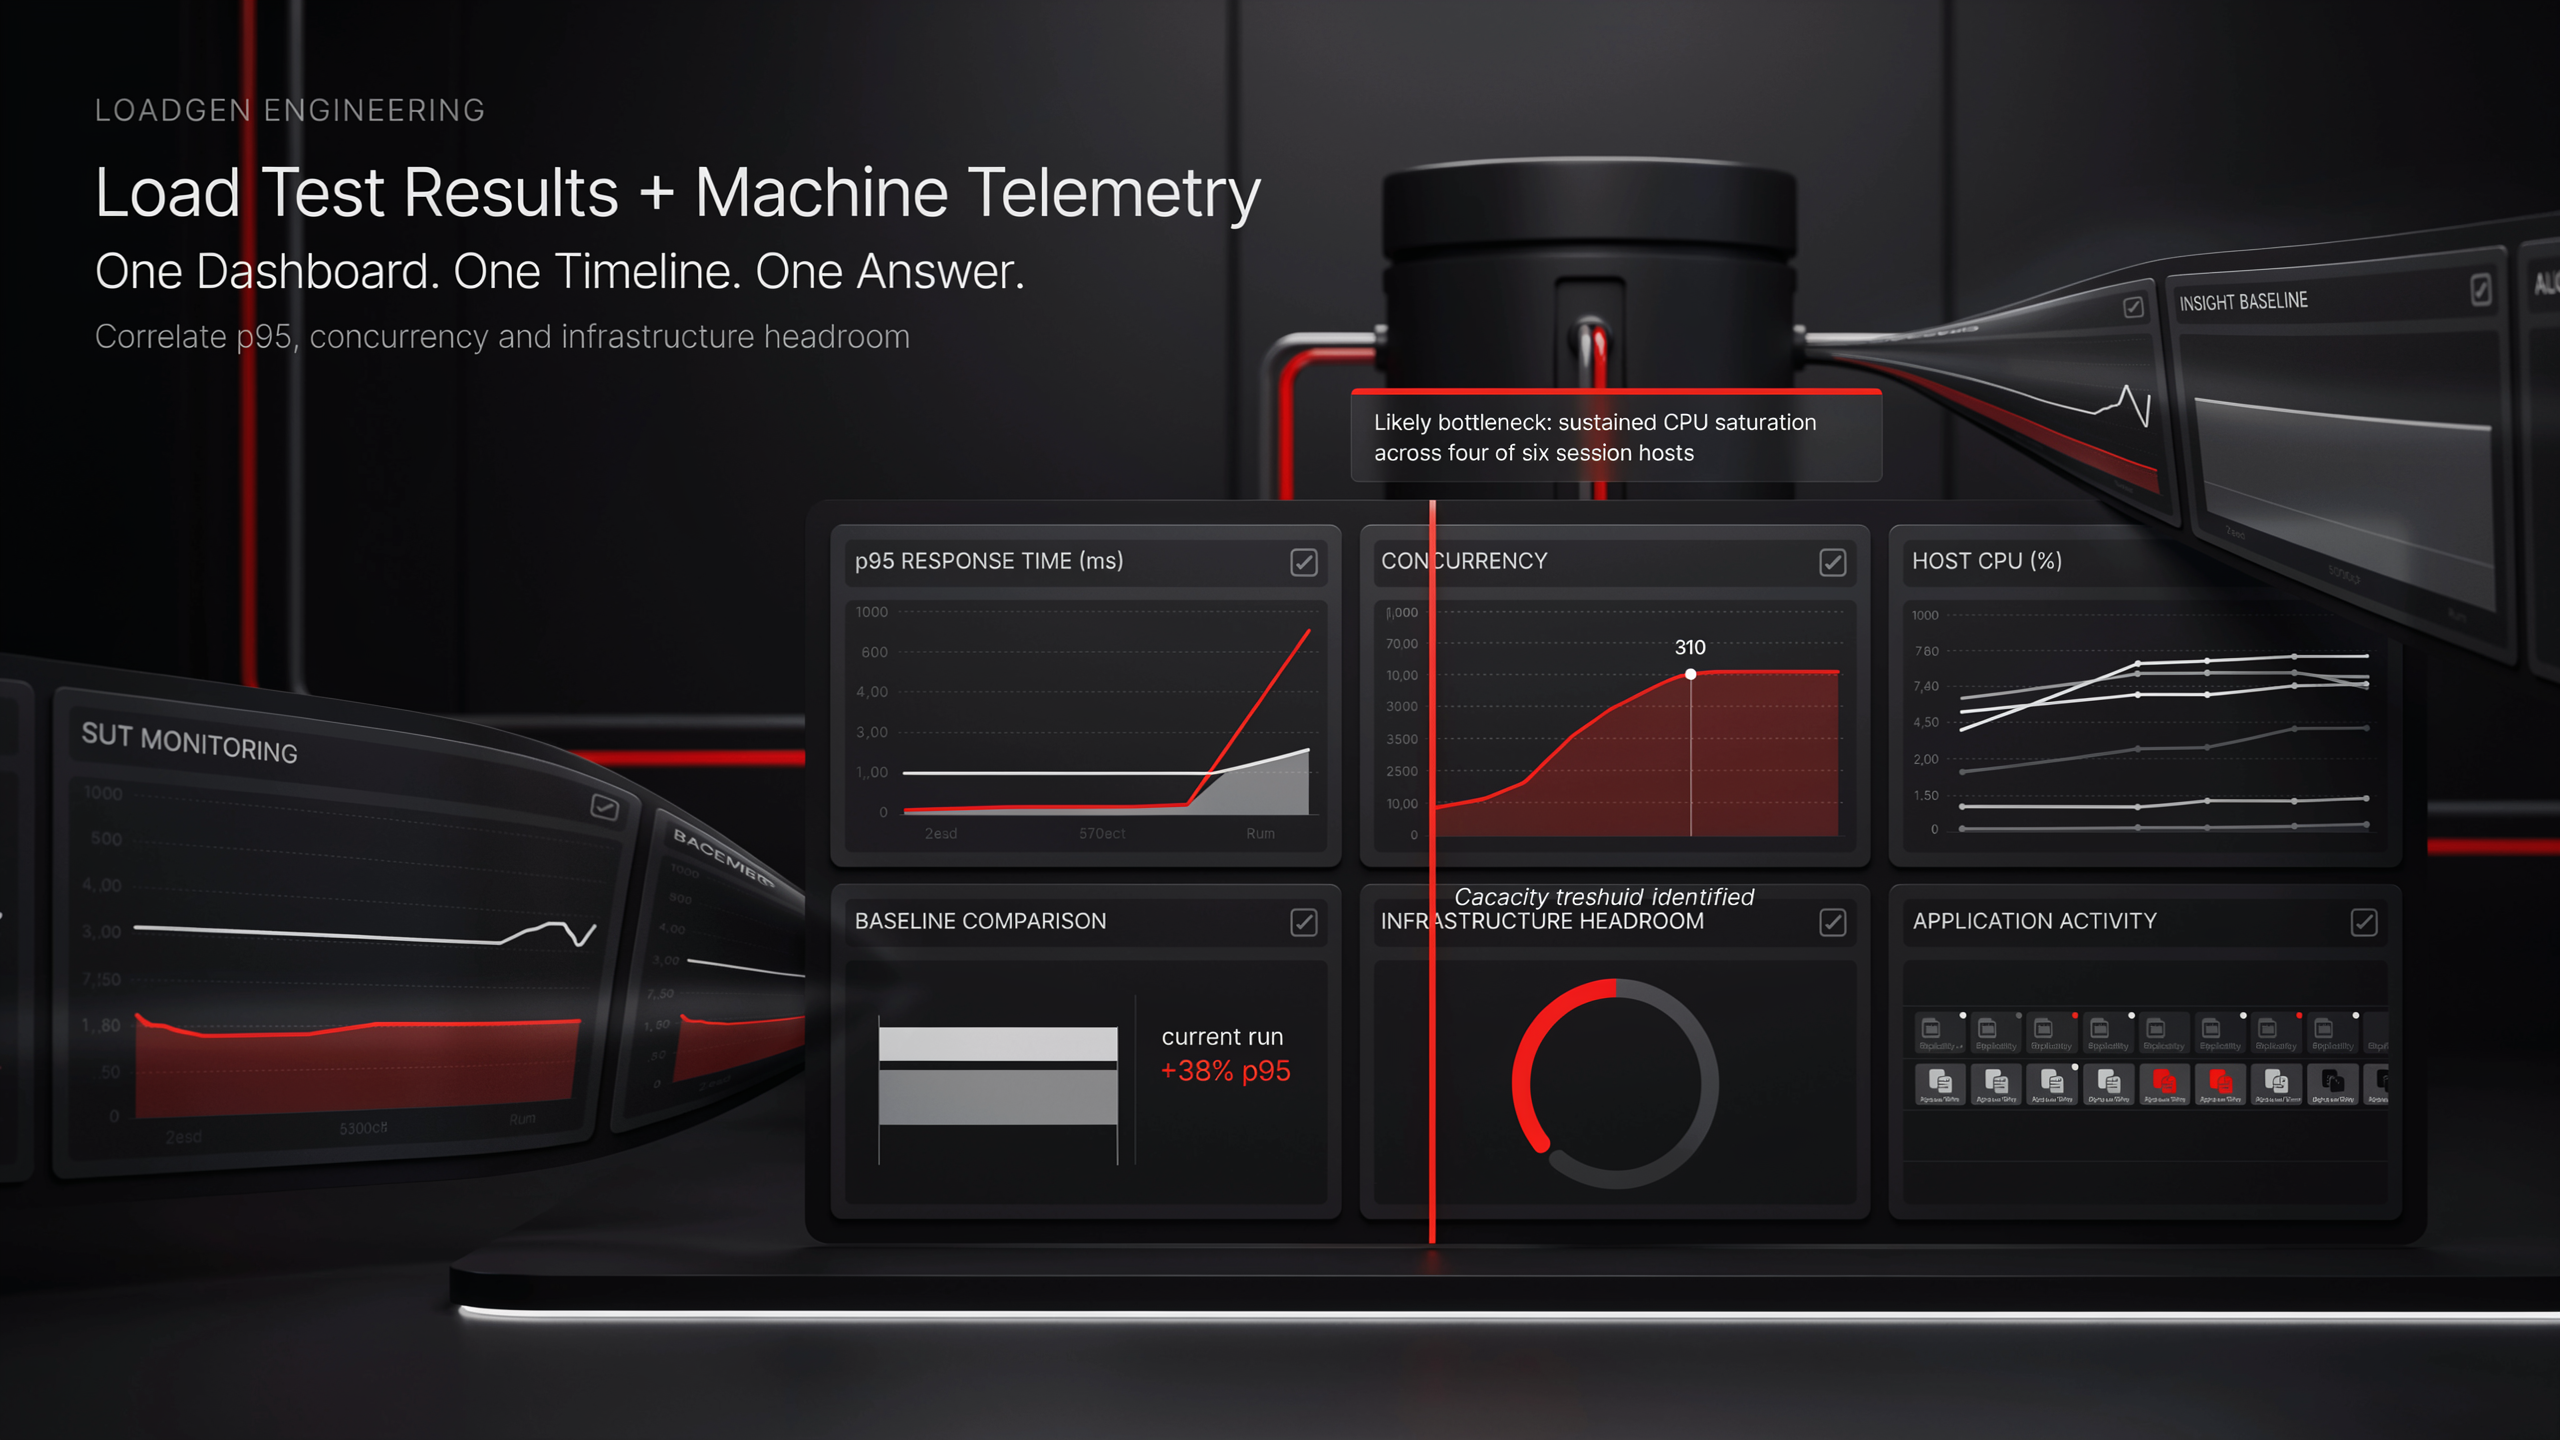
Combine Machine Telemetry with Load Test Results in One Dashboard | LoadGen
Load tests tell you p95 went up. Machine telemetry tells you why. Build one dashboard over both — in LoadGen Analyse with AI, or in Grafana over the same InfluxDB.
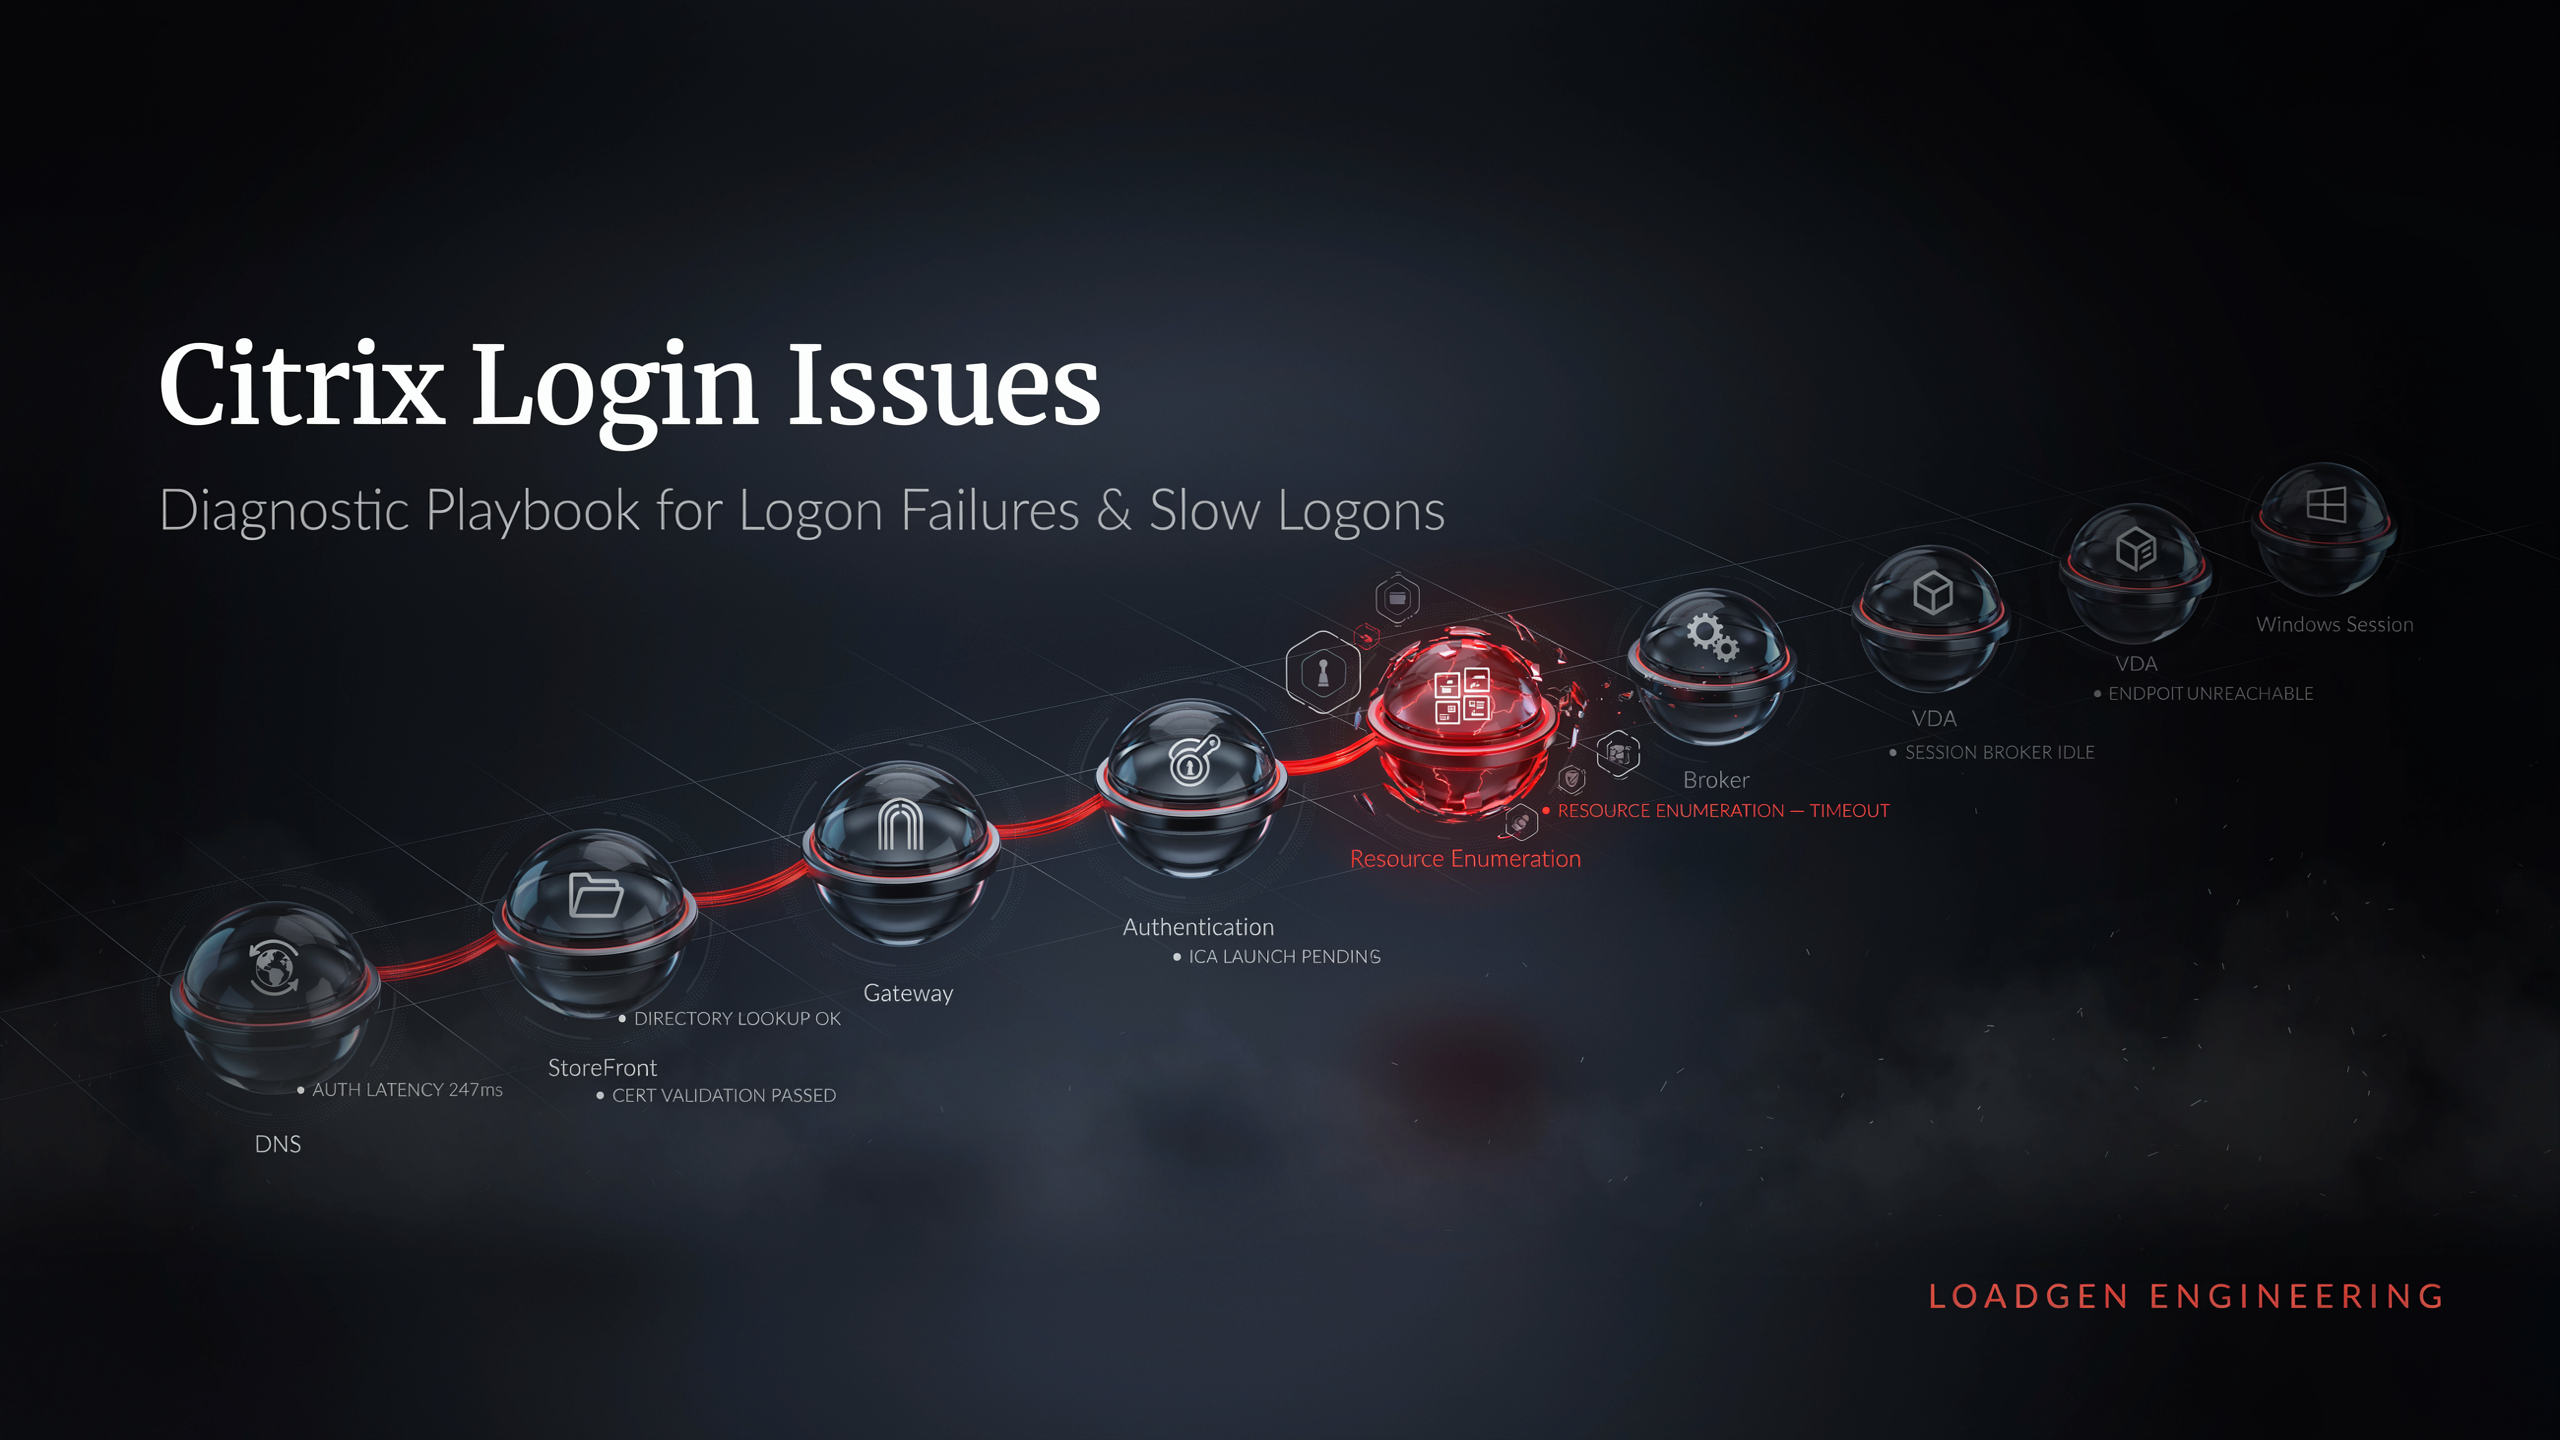
Citrix Login Issues — Diagnostic Playbook for Logon Failures & Slow Logons | LoadGen
Citrix not loading, logon failures, "failed to launch due to resource enumeration"? Work the logon chain step by step — and monitor it so you see the next one first.
Ready to baseline your environment?
Run the wizard, hit the cockpit, watch the audit trail build itself.
